Picture this: You've got lab results back for a wellsite closure project. 12 monitoring wells, 47 analytical parameters per sample, across soil and groundwater. That's hundreds of data points, each needing to be compared against the correct Alberta Tier 1 guideline value based on media type, land use, and soil texture. You open Excel. And you start the VLOOKUP grind.
The Scale of the Problem
Let's do the math. A typical Phase II ESA at an oil and gas wellsite in Alberta might involve:
- 8-15 boreholes with soil samples at multiple depths
- 4-8 monitoring wells for groundwater
- 30-50 analytical parameters per sample (PHCs, BTEX, metals, salinity, etc.)
- Multiple guideline tables depending on land use (agricultural, residential, commercial/industrial)
That's easily 500-1,000+ individual data-to-guideline comparisons per site. And each one needs to account for the correct units, detection limits, and applicable criteria.
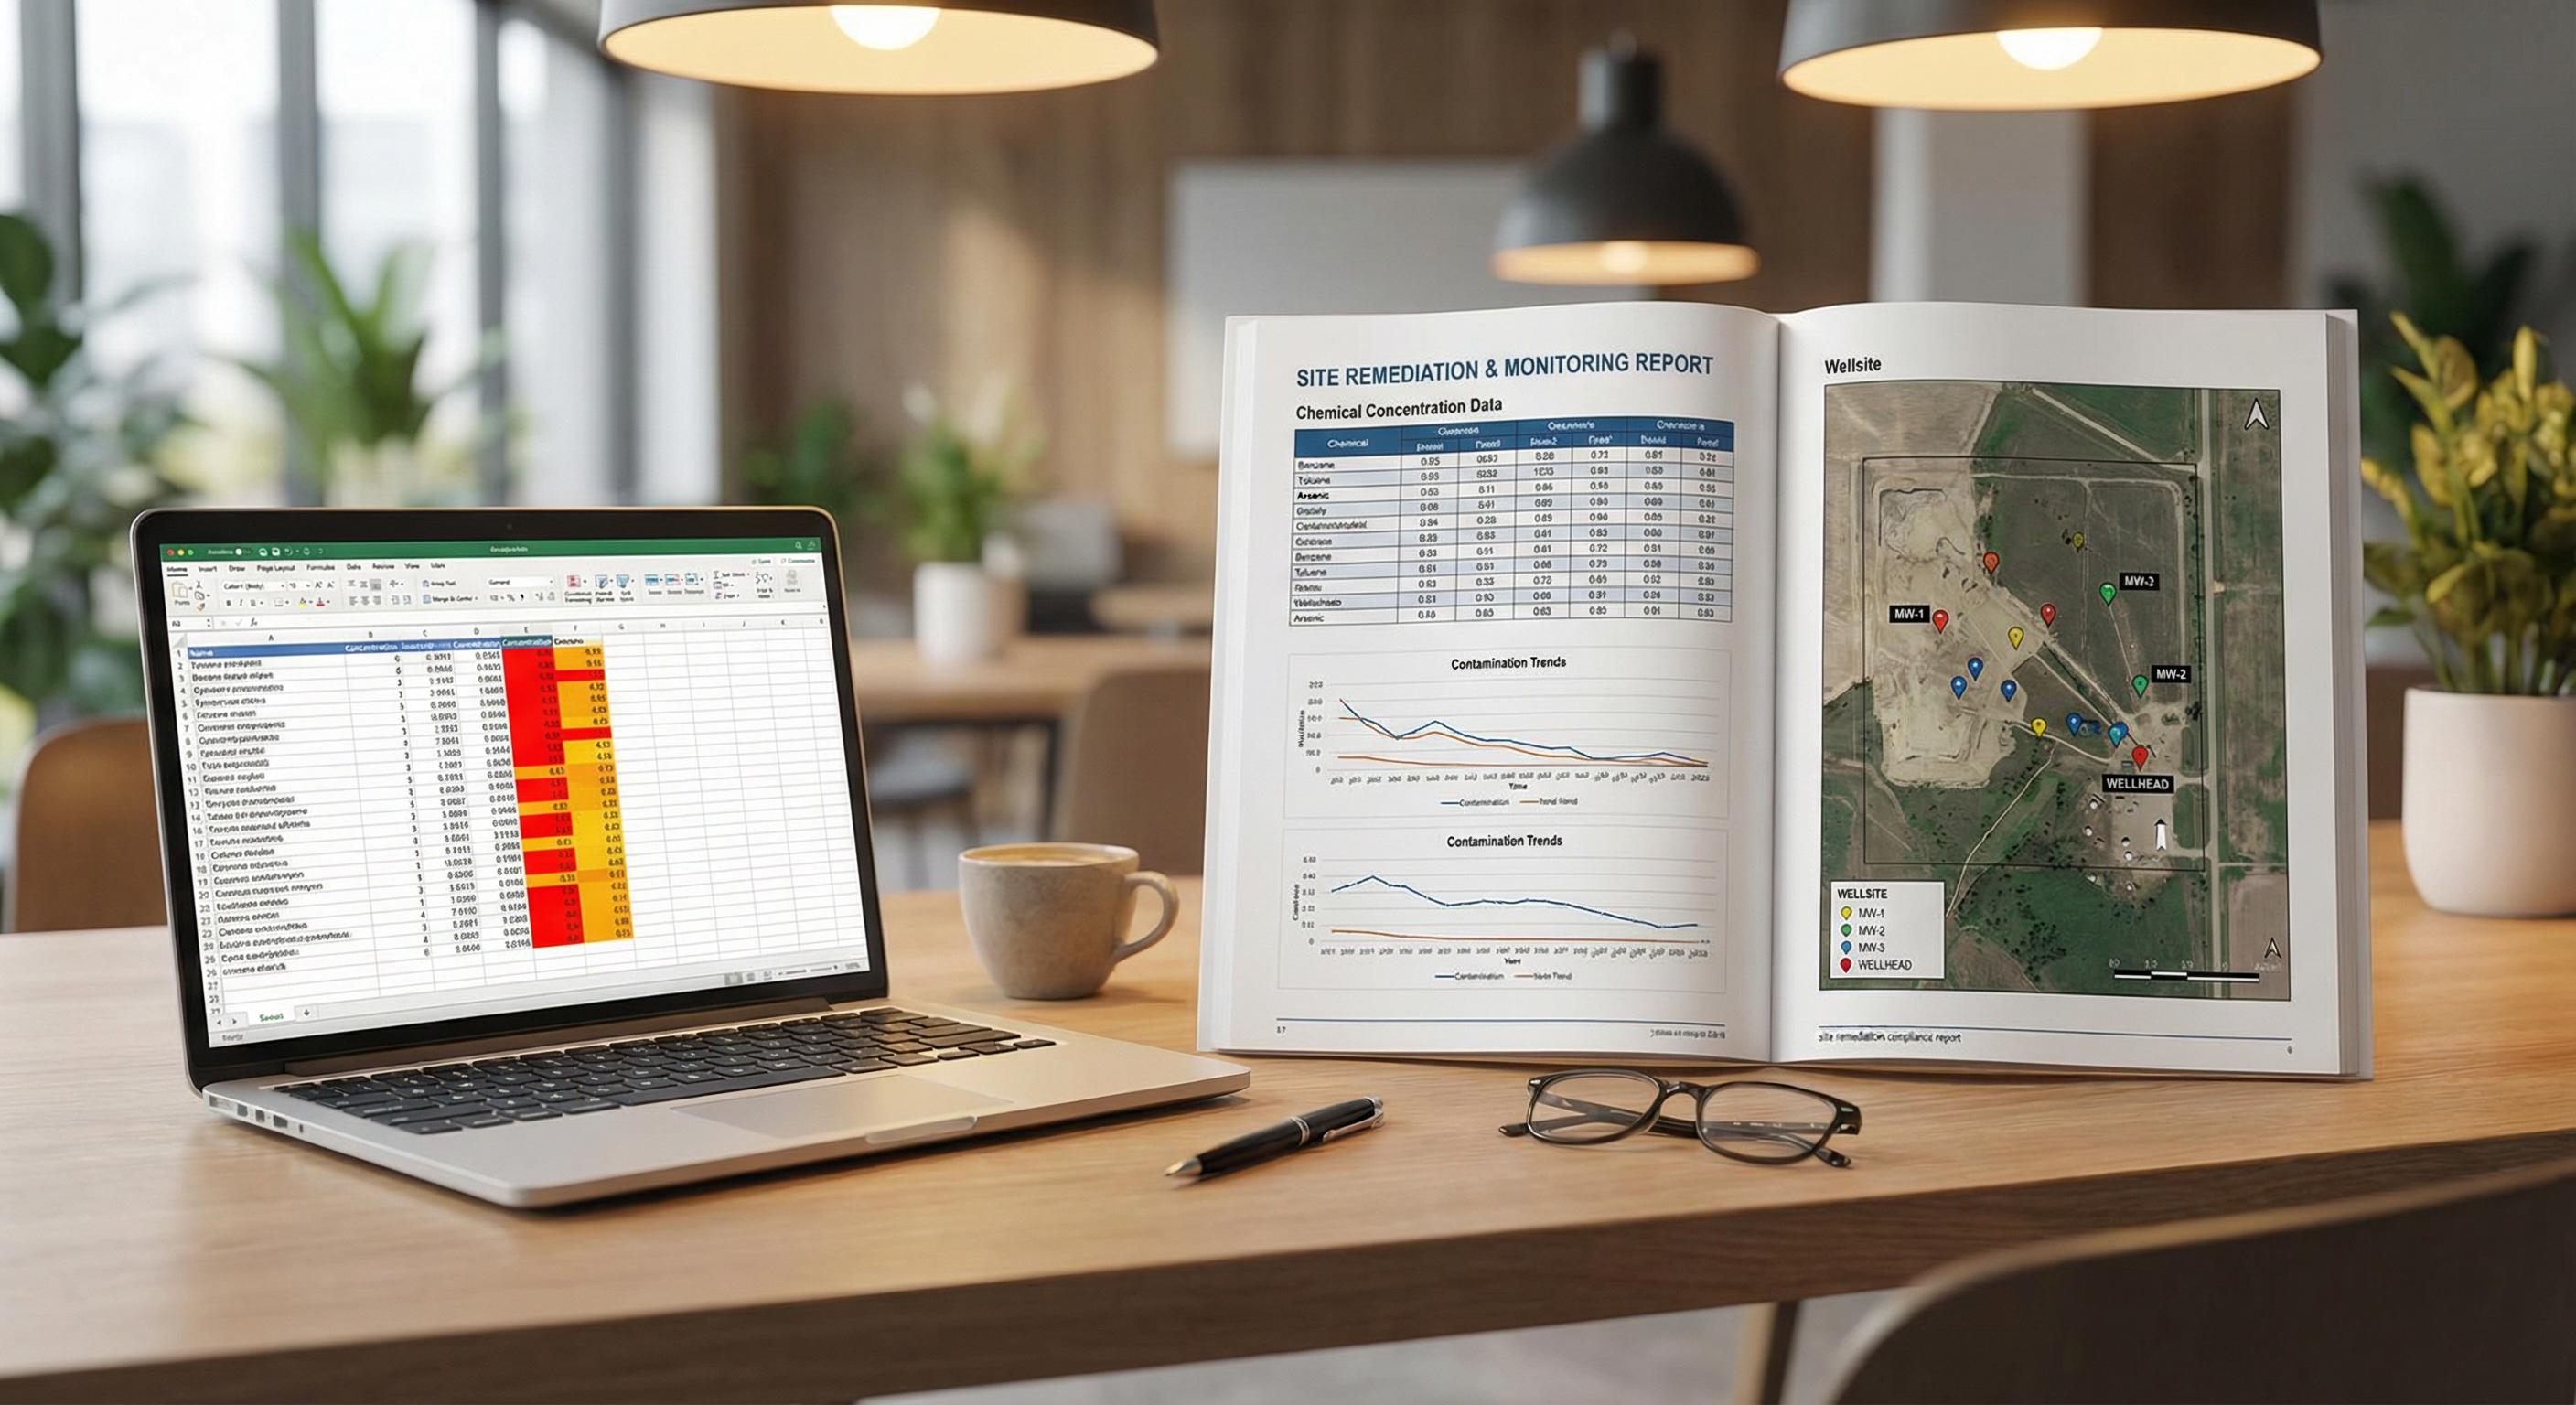 The familiar scene: colour-coded Excel, manual guideline lookups, and a looming deadline. There's a better way.
Where Manual Checking Goes Wrong
Environmental consultants are skilled professionals. But when you're doing repetitive data comparisons in Excel, errors creep in. The most common failure modes we see:
1. Wrong Guideline Applied
Alberta Tier 1 guidelines vary by soil texture (coarse vs. fine-grained) and land use. It's surprisingly easy to compare a fine-grained soil result against a coarse-grained guideline -- or to apply a residential standard when the site is actually industrial. One wrong column reference in a VLOOKUP and the entire comparison is off.
2. Unit Mismatches
Labs report in mg/kg, µg/L, mg/L, ppm, ppb -- sometimes within the same certificate of analysis. Guidelines might be in different units. A consultant who doesn't catch a mg/L vs. µg/L mismatch is comparing values that are off by a factor of 1,000.
3. Detection Limit Handling
Non-detect results (values below the lab's method detection limit) need careful handling. Do you use half the detection limit? The full MDL? Zero? The approach affects whether a parameter shows as an exceedance or not, and it needs to be consistent and defensible.
4. Missed Exceedances
Perhaps the most dangerous failure mode: a genuine exceedance that gets missed because of a formula error, a sorting mistake, or simple fatigue after checking 800 values in a row. A missed exceedance can mean a contaminated site gets a clean closure -- an outcome that can surface years later as a liability.
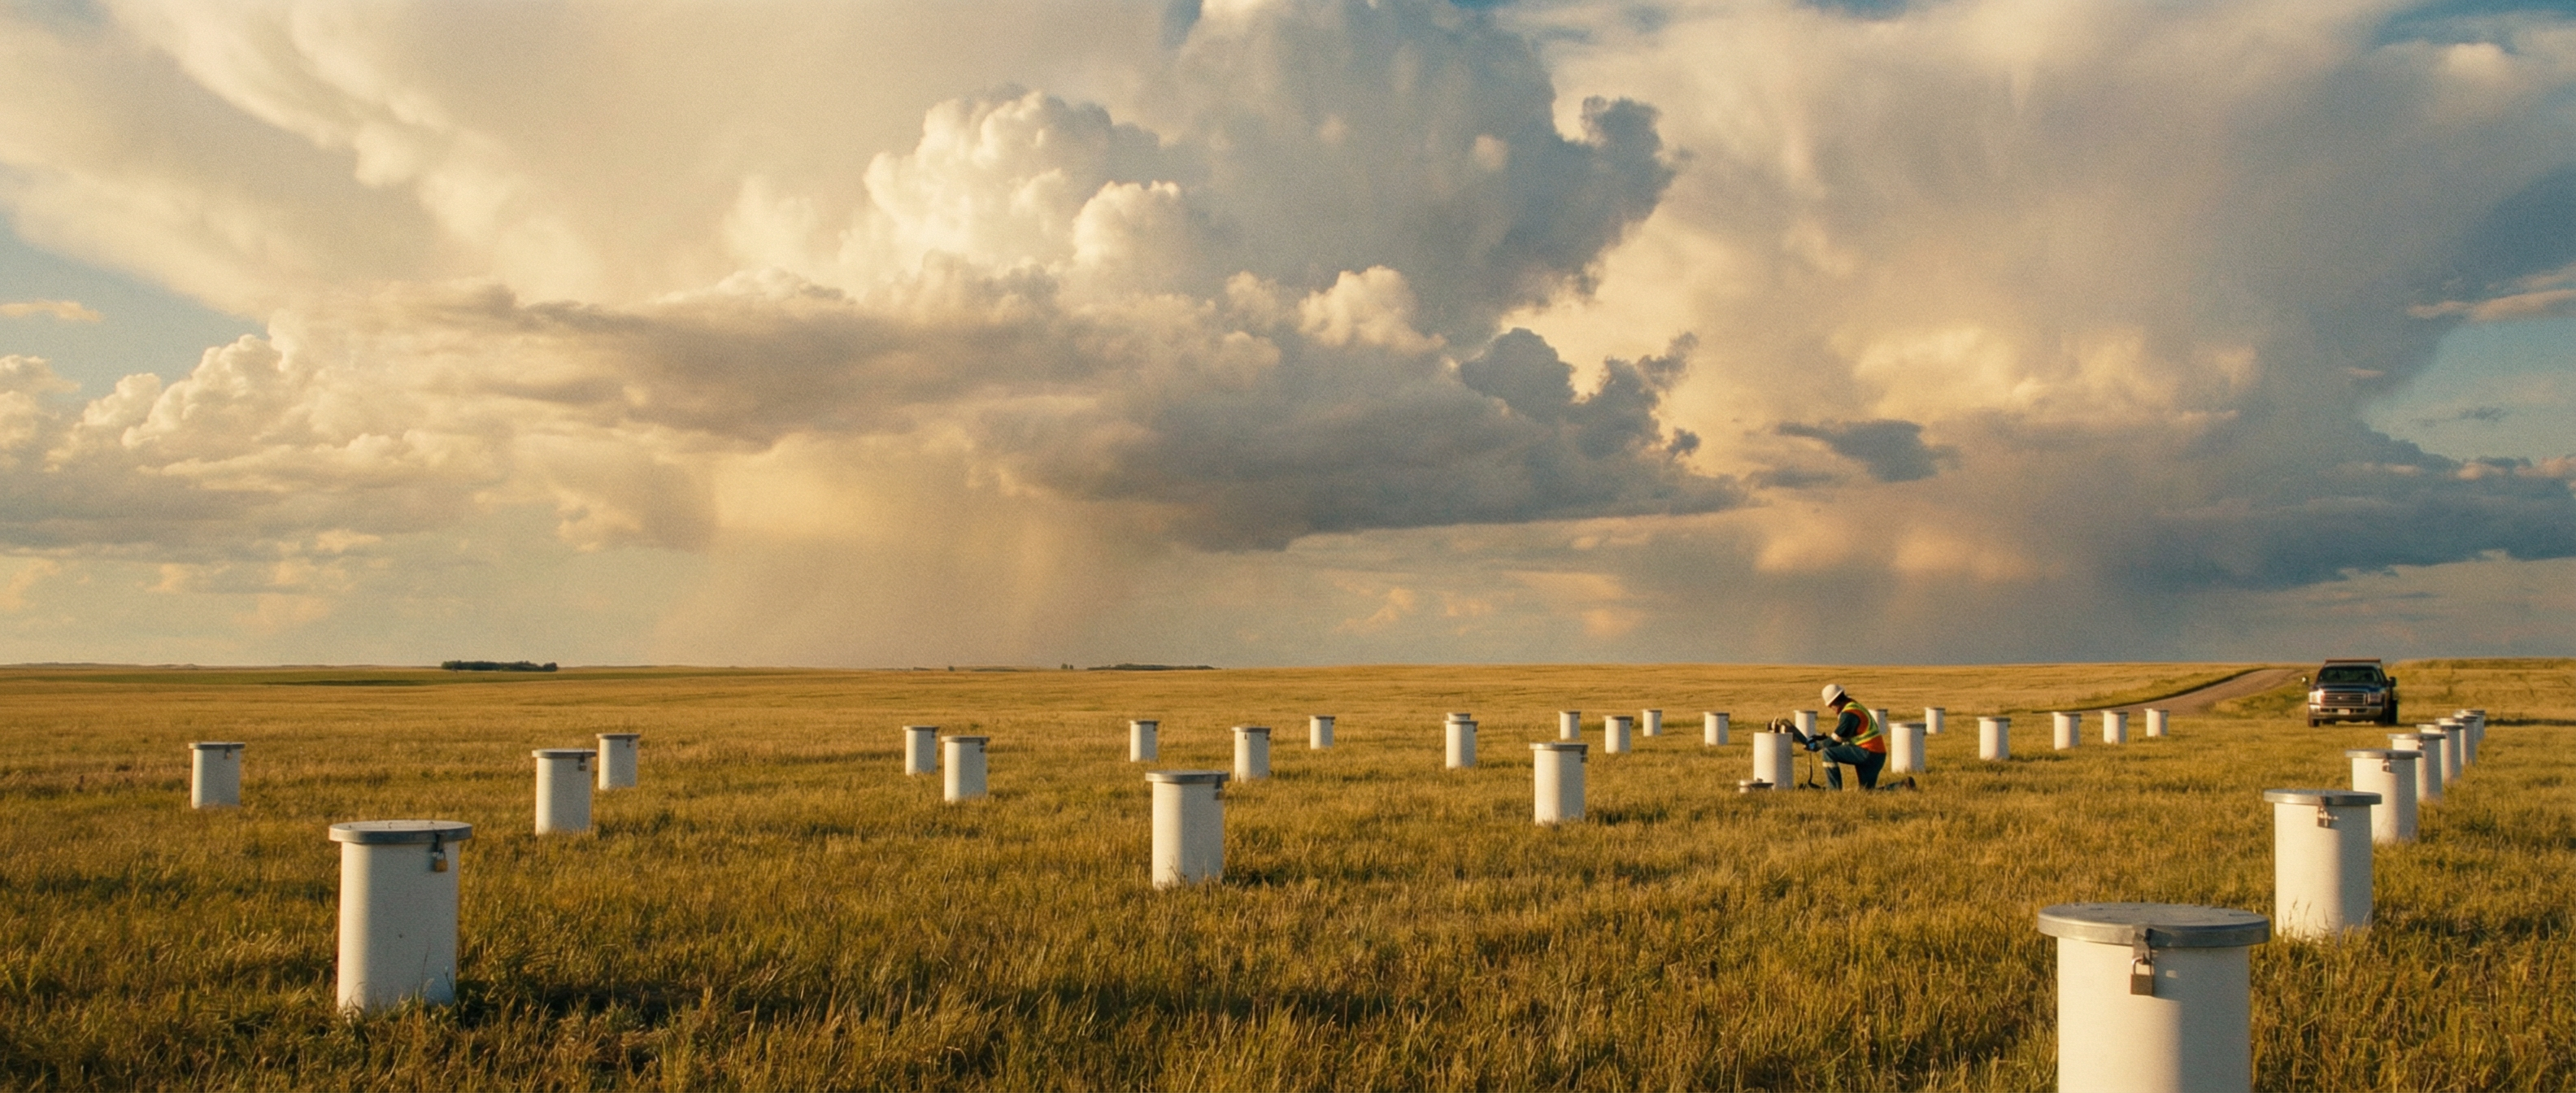 Monitoring wells across a prairie site. Each one represents dozens of parameters that need to be checked against regulatory guidelines.
What Automated Exceedance Flagging Actually Looks Like
This is the core problem [GRYD] was built to solve. Here's what the automated workflow looks like compared to the manual approach:
Manual (Excel)
- Receive lab data (PDF + CSV)
- Reformat into your working spreadsheet
- Manually look up each parameter's guideline value
- Build VLOOKUP formulas for each media/land-use combo
- Apply conditional formatting
- Double-check units, soil texture, detection limits
- Review and QA the entire table manually
- Build summary tables for the report
Time: 4-8 hours per site
[GRYD] Automated
- Upload lab data
- Parameters auto-mapped to guidelines
- Units auto-detected and normalized
- Exceedances flagged instantly
- Severity classified (marginal, moderate, significant)
- Full audit trail generated
- Export report-ready tables
Time: 10-15 minutes per site
The Real Cost of Doing It Manually
If your firm is running 50+ sites per year (not unusual for mid-size environmental consultancies in Alberta), and each site takes 4-8 hours of manual data comparison, that's 200-400 hours per year spent on a task that can be automated.
At a billing rate of $120-$150/hour, that's $24,000 - $60,000/year in time that could be spent on interpretation, client communication, and higher-value technical work.
And that doesn't account for the cost of errors -- missed exceedances, incorrect guideline application, and the credibility damage that comes with submitting a report that a regulator later finds fault with.
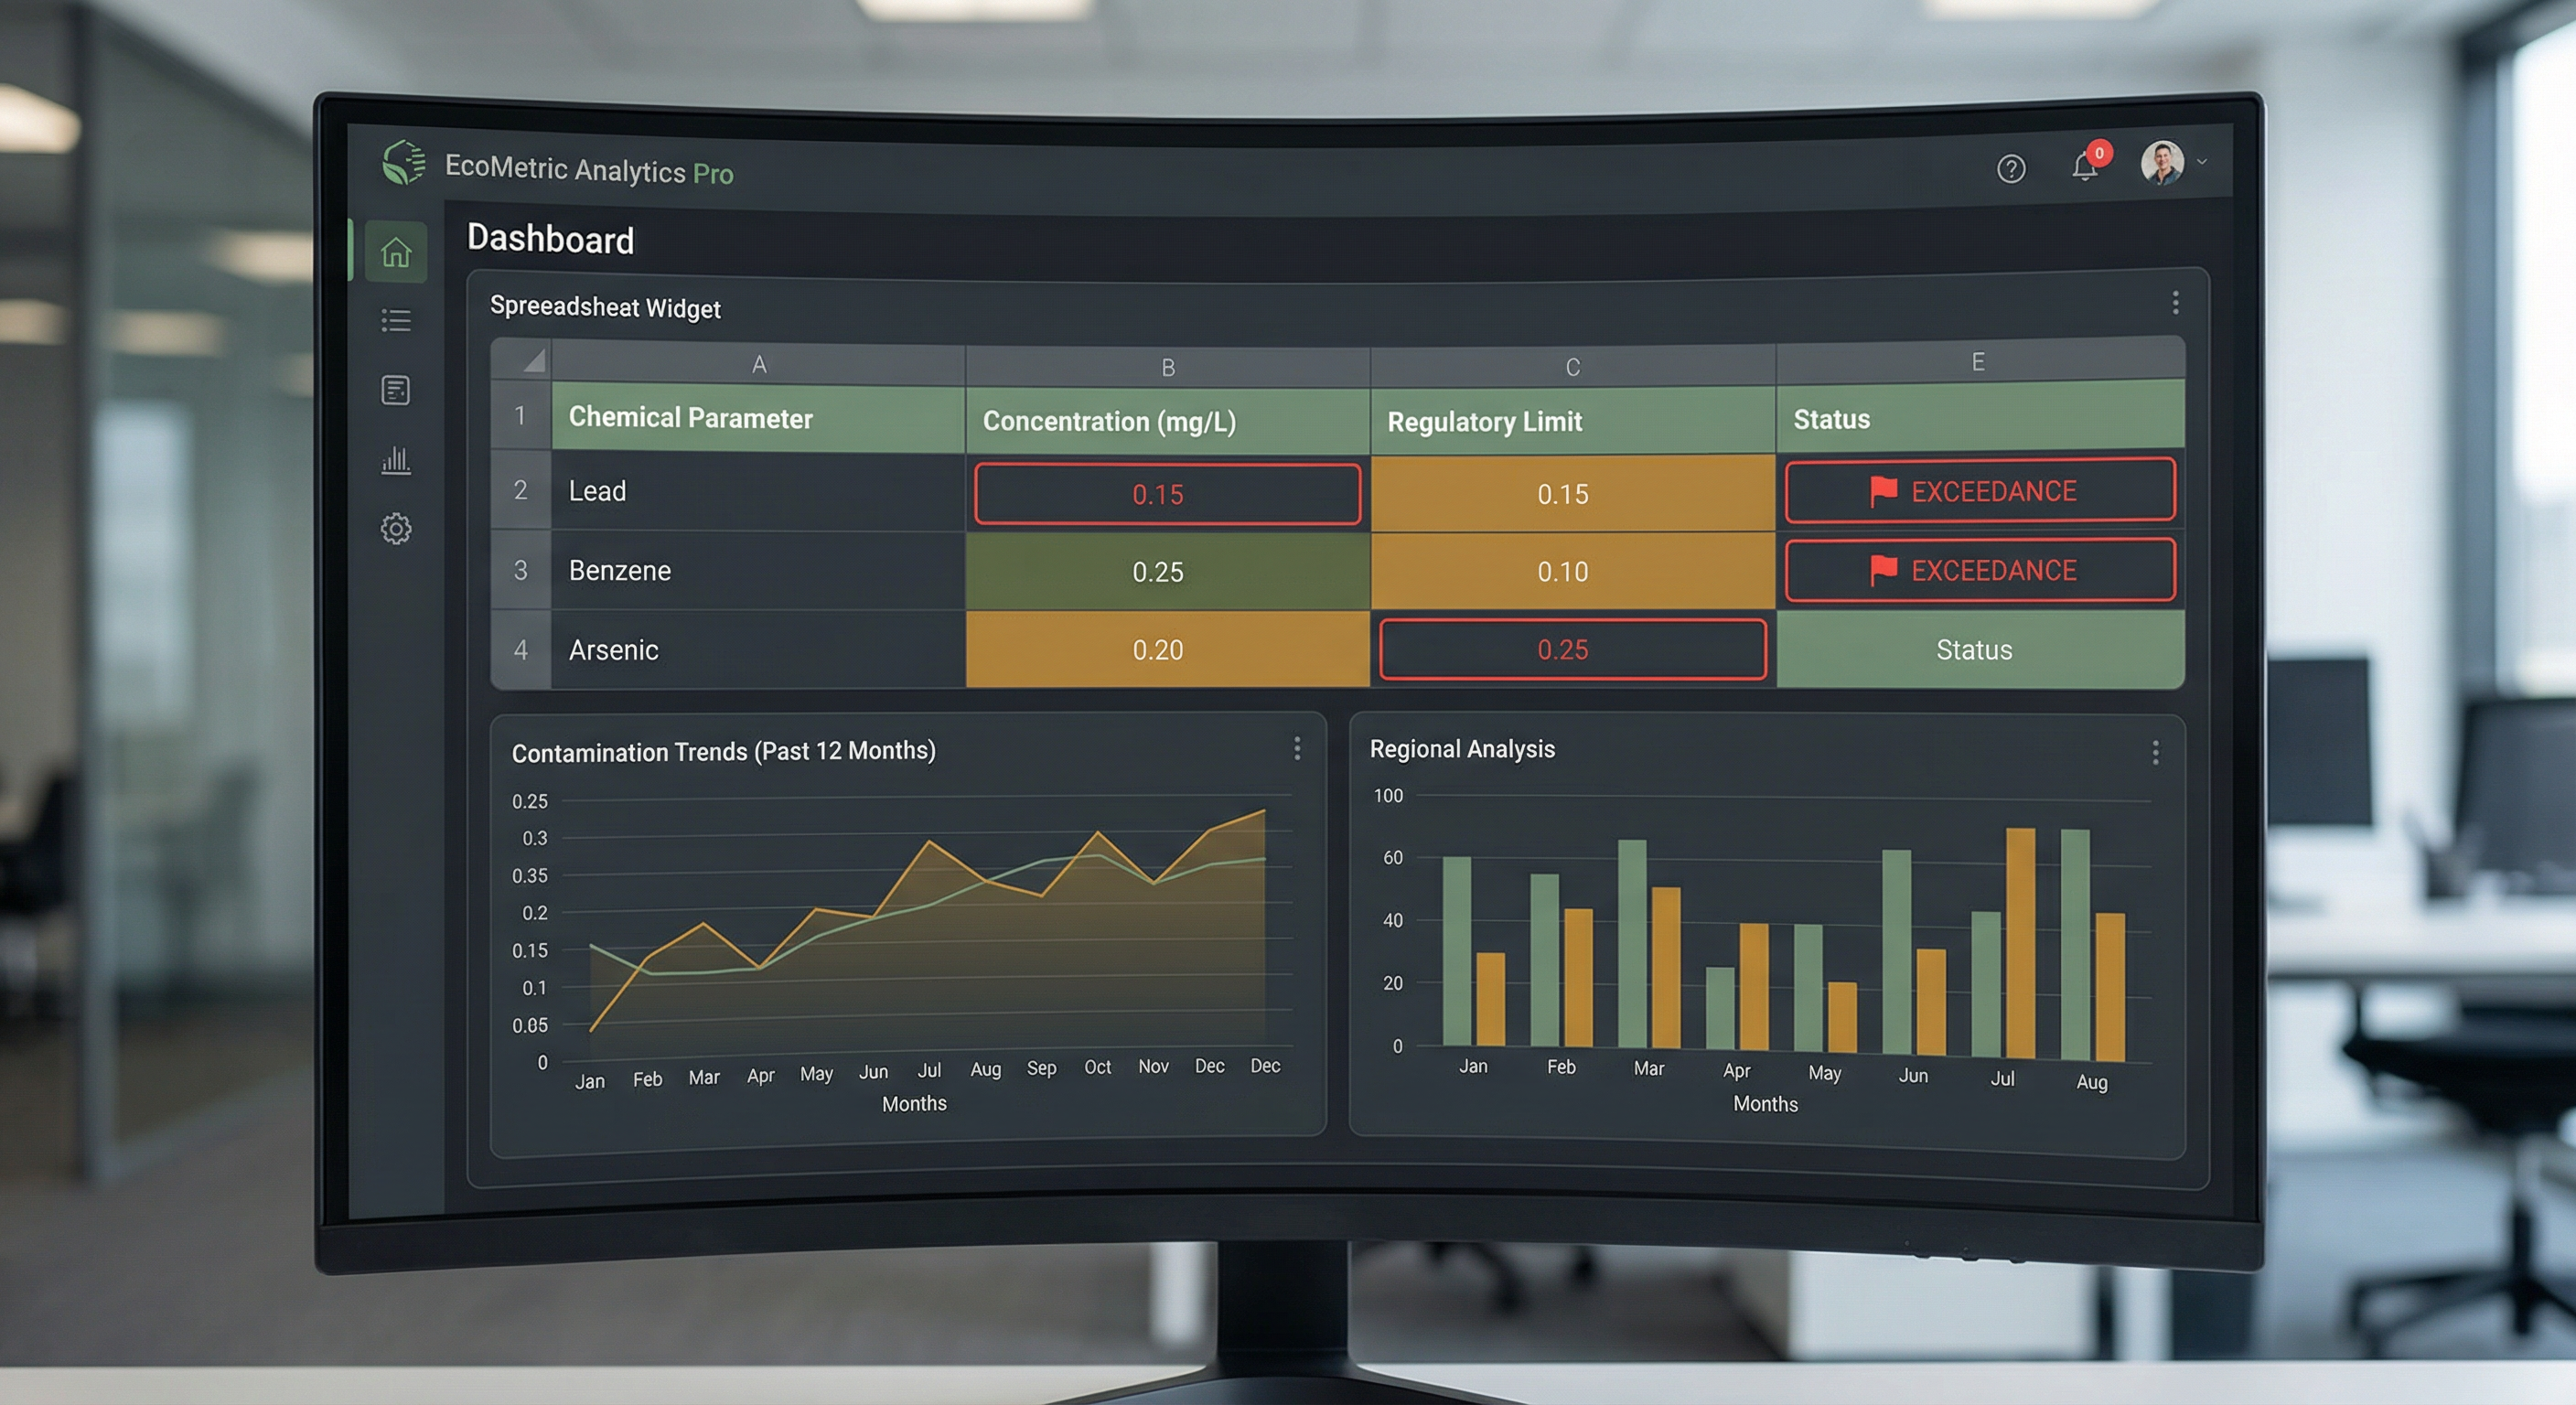 [GRYD]'s exceedance dashboard: every parameter, every guideline, every flag -- visible at a glance with full audit trail.
Making the Shift
Switching from manual to automated exceedance checking doesn't mean losing control. [GRYD] gives you full visibility into every comparison -- which guideline was applied, what the original value was, what unit conversion was performed, and why it was flagged. The difference is that the initial heavy lifting is done in seconds instead of hours, and you spend your time reviewing and interpreting rather than copy-pasting and cross-referencing.
For firms looking to scale their remediation practice without proportionally scaling their data analysis overhead, this is the unlock.
See the Difference for Yourself
Try [GRYD] on your next site project and see how much time automated exceedance reporting saves your team.