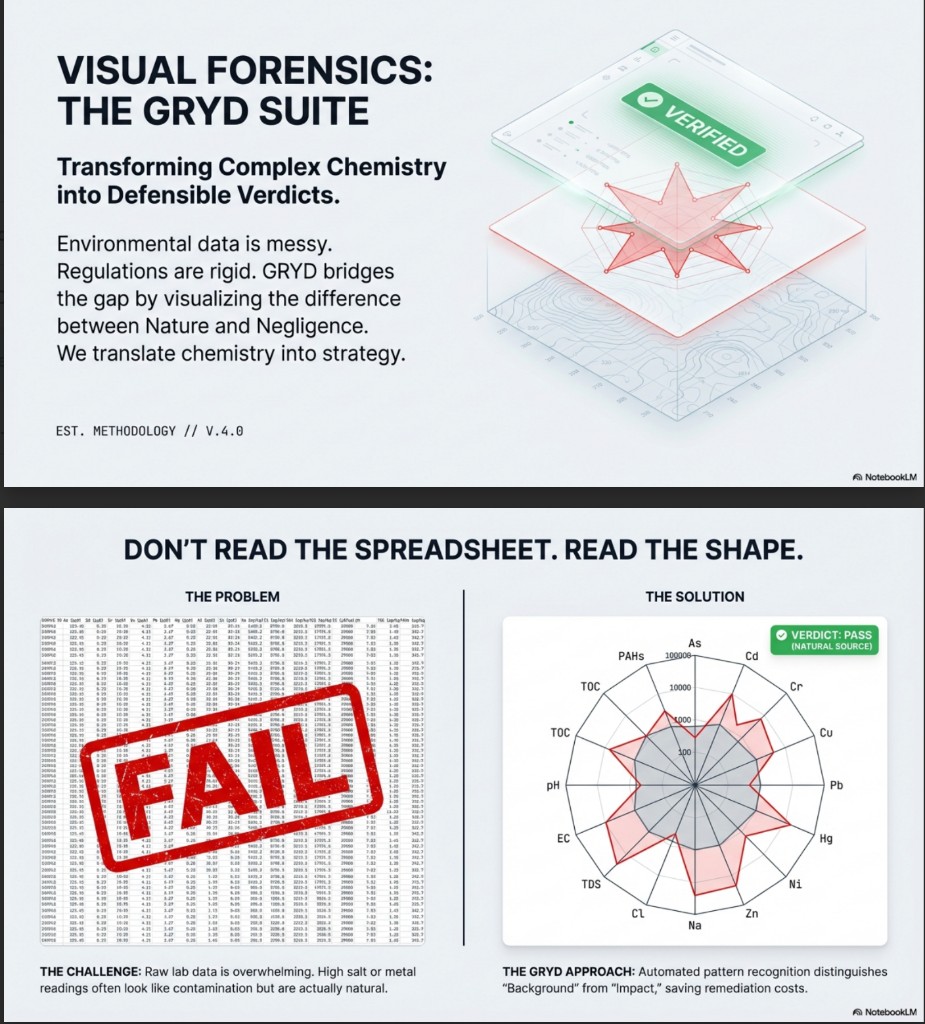
Forensic Hydrogeochemistry in Practice: When to Reach for Piper, Stiff, Gibbs, or Source Discriminator
You have a groundwater dataset and a question about its origin. Different diagrams answer different questions. Here's a decision tree for picking the right one — and what each tells you that a basic exceedance table can't.
Read article →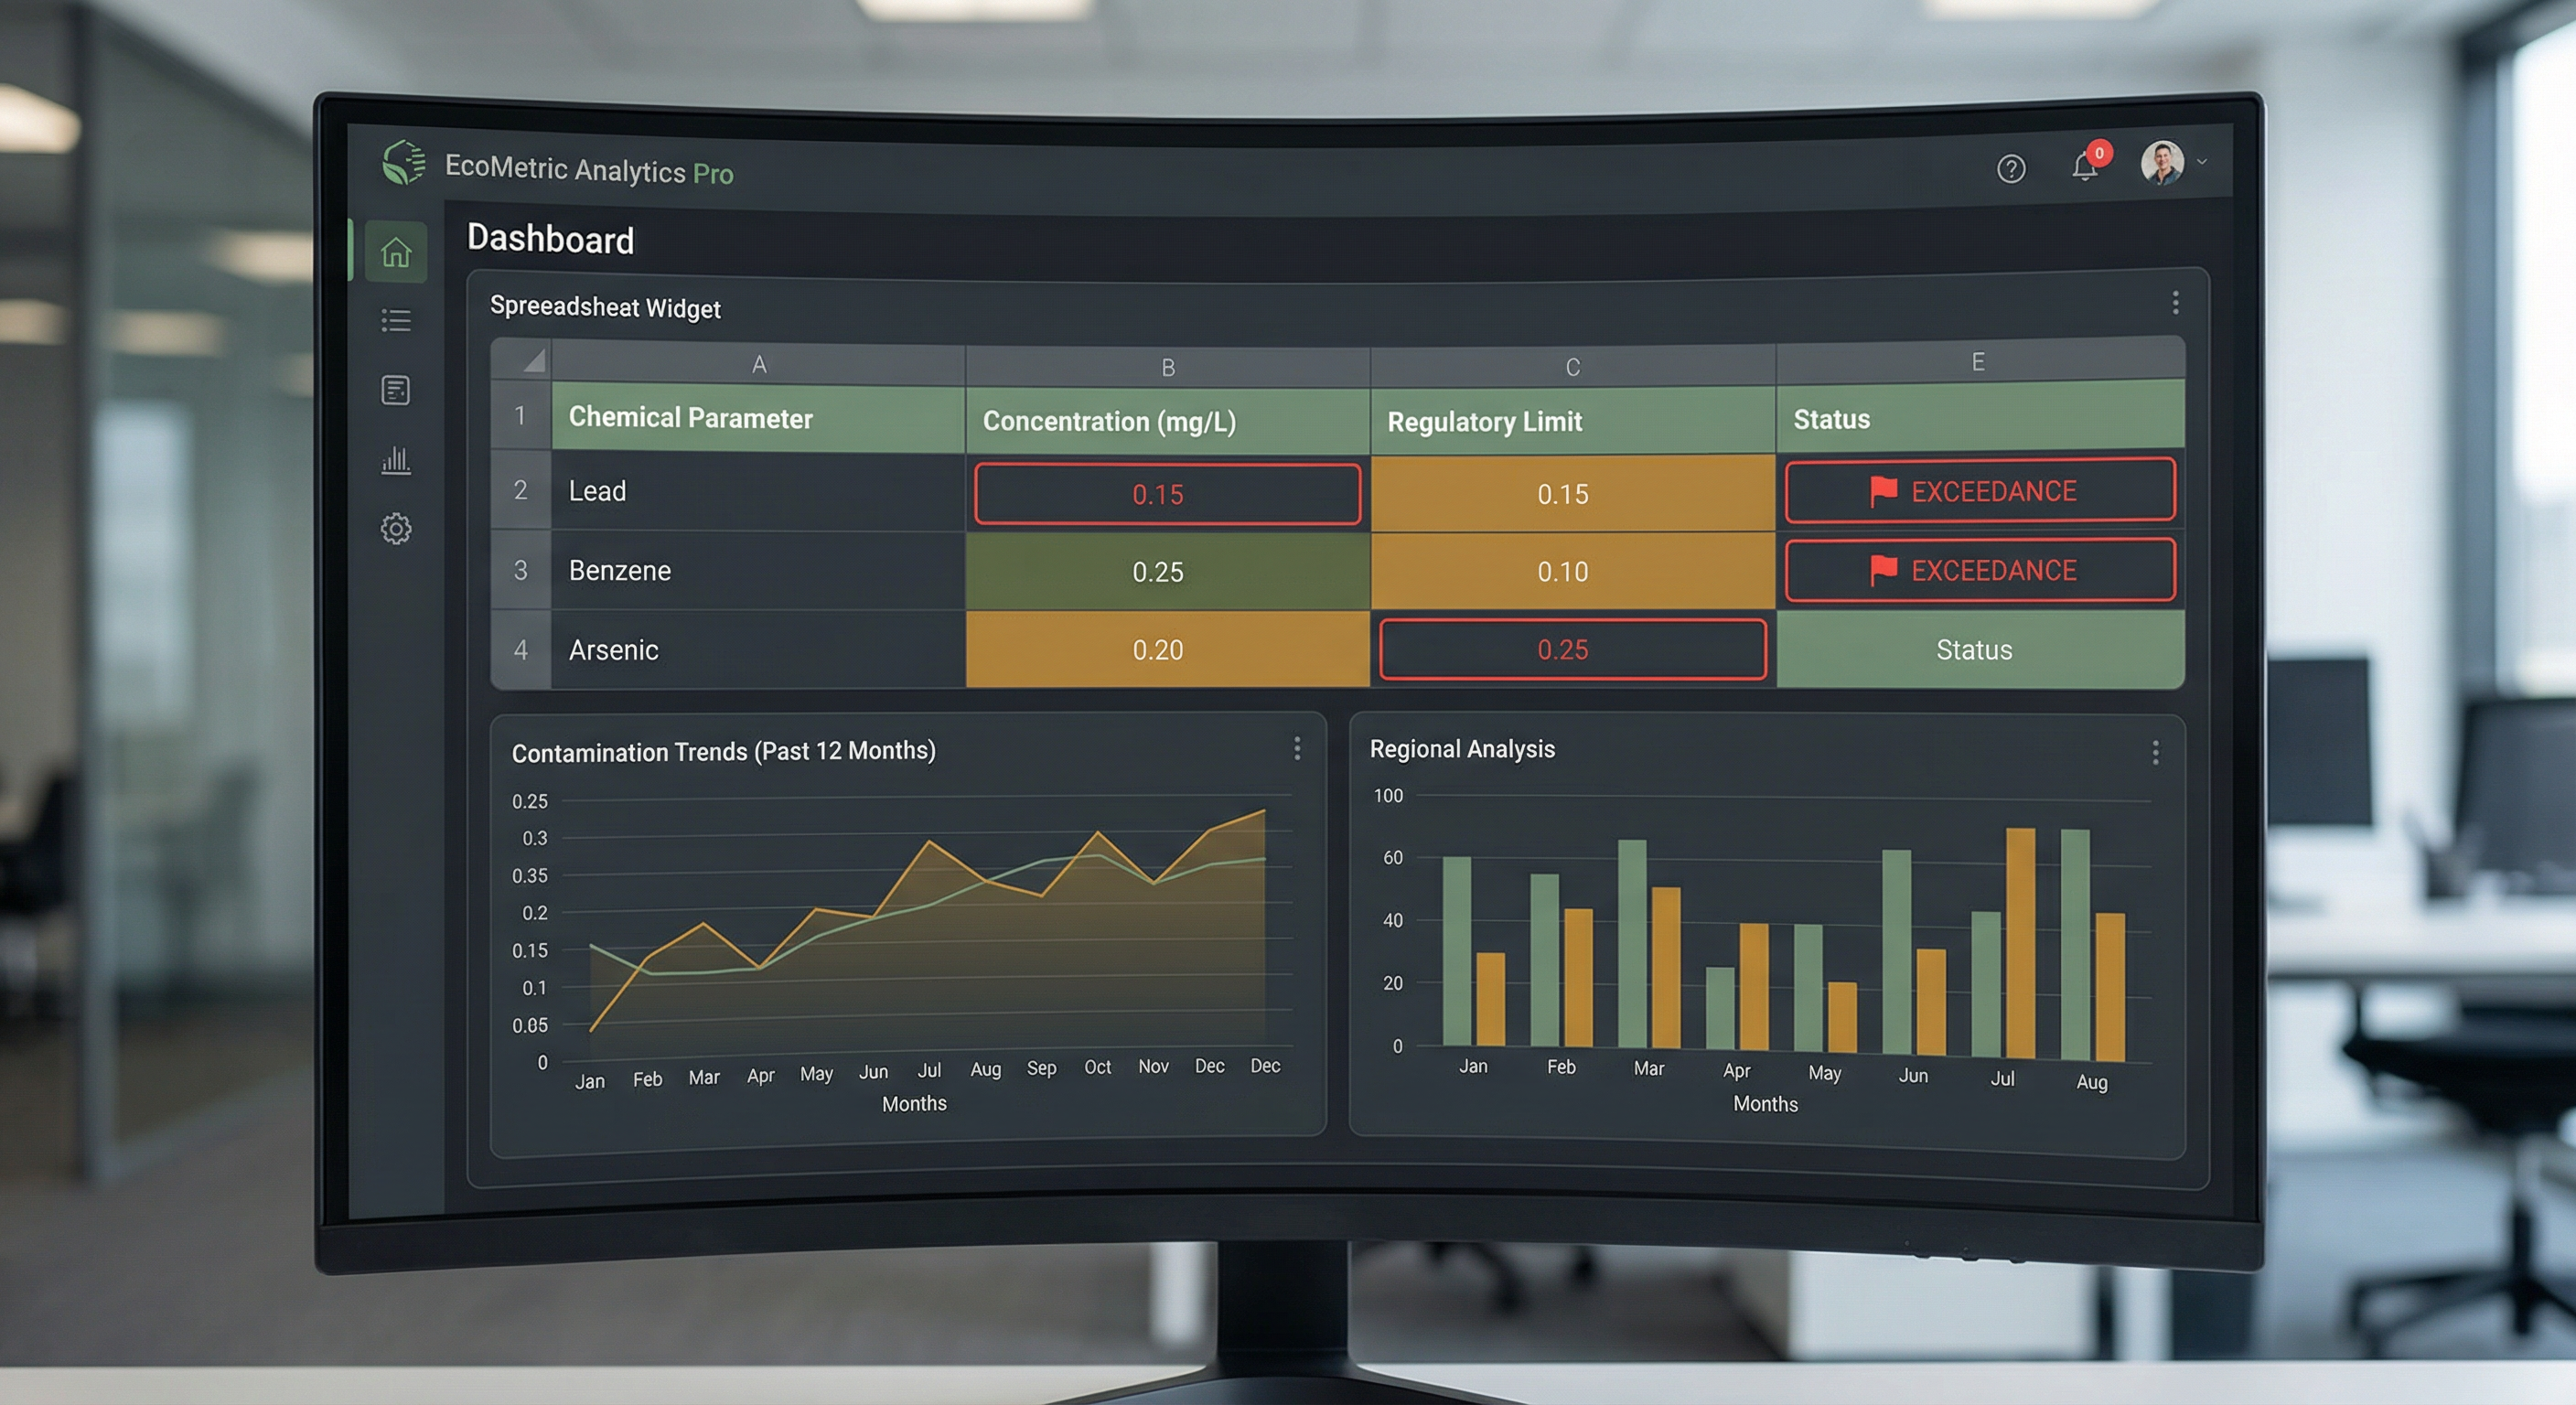
Asking Your Data Questions: Using AI to Interpret Environmental Exceedance Reports
A general-purpose chatbot will hallucinate a CCME number at you. A grounded AI agent reads your actual screening output, cites the row, and stops where the data stops. Here's the difference, and why it matters for defensibility.
Read article →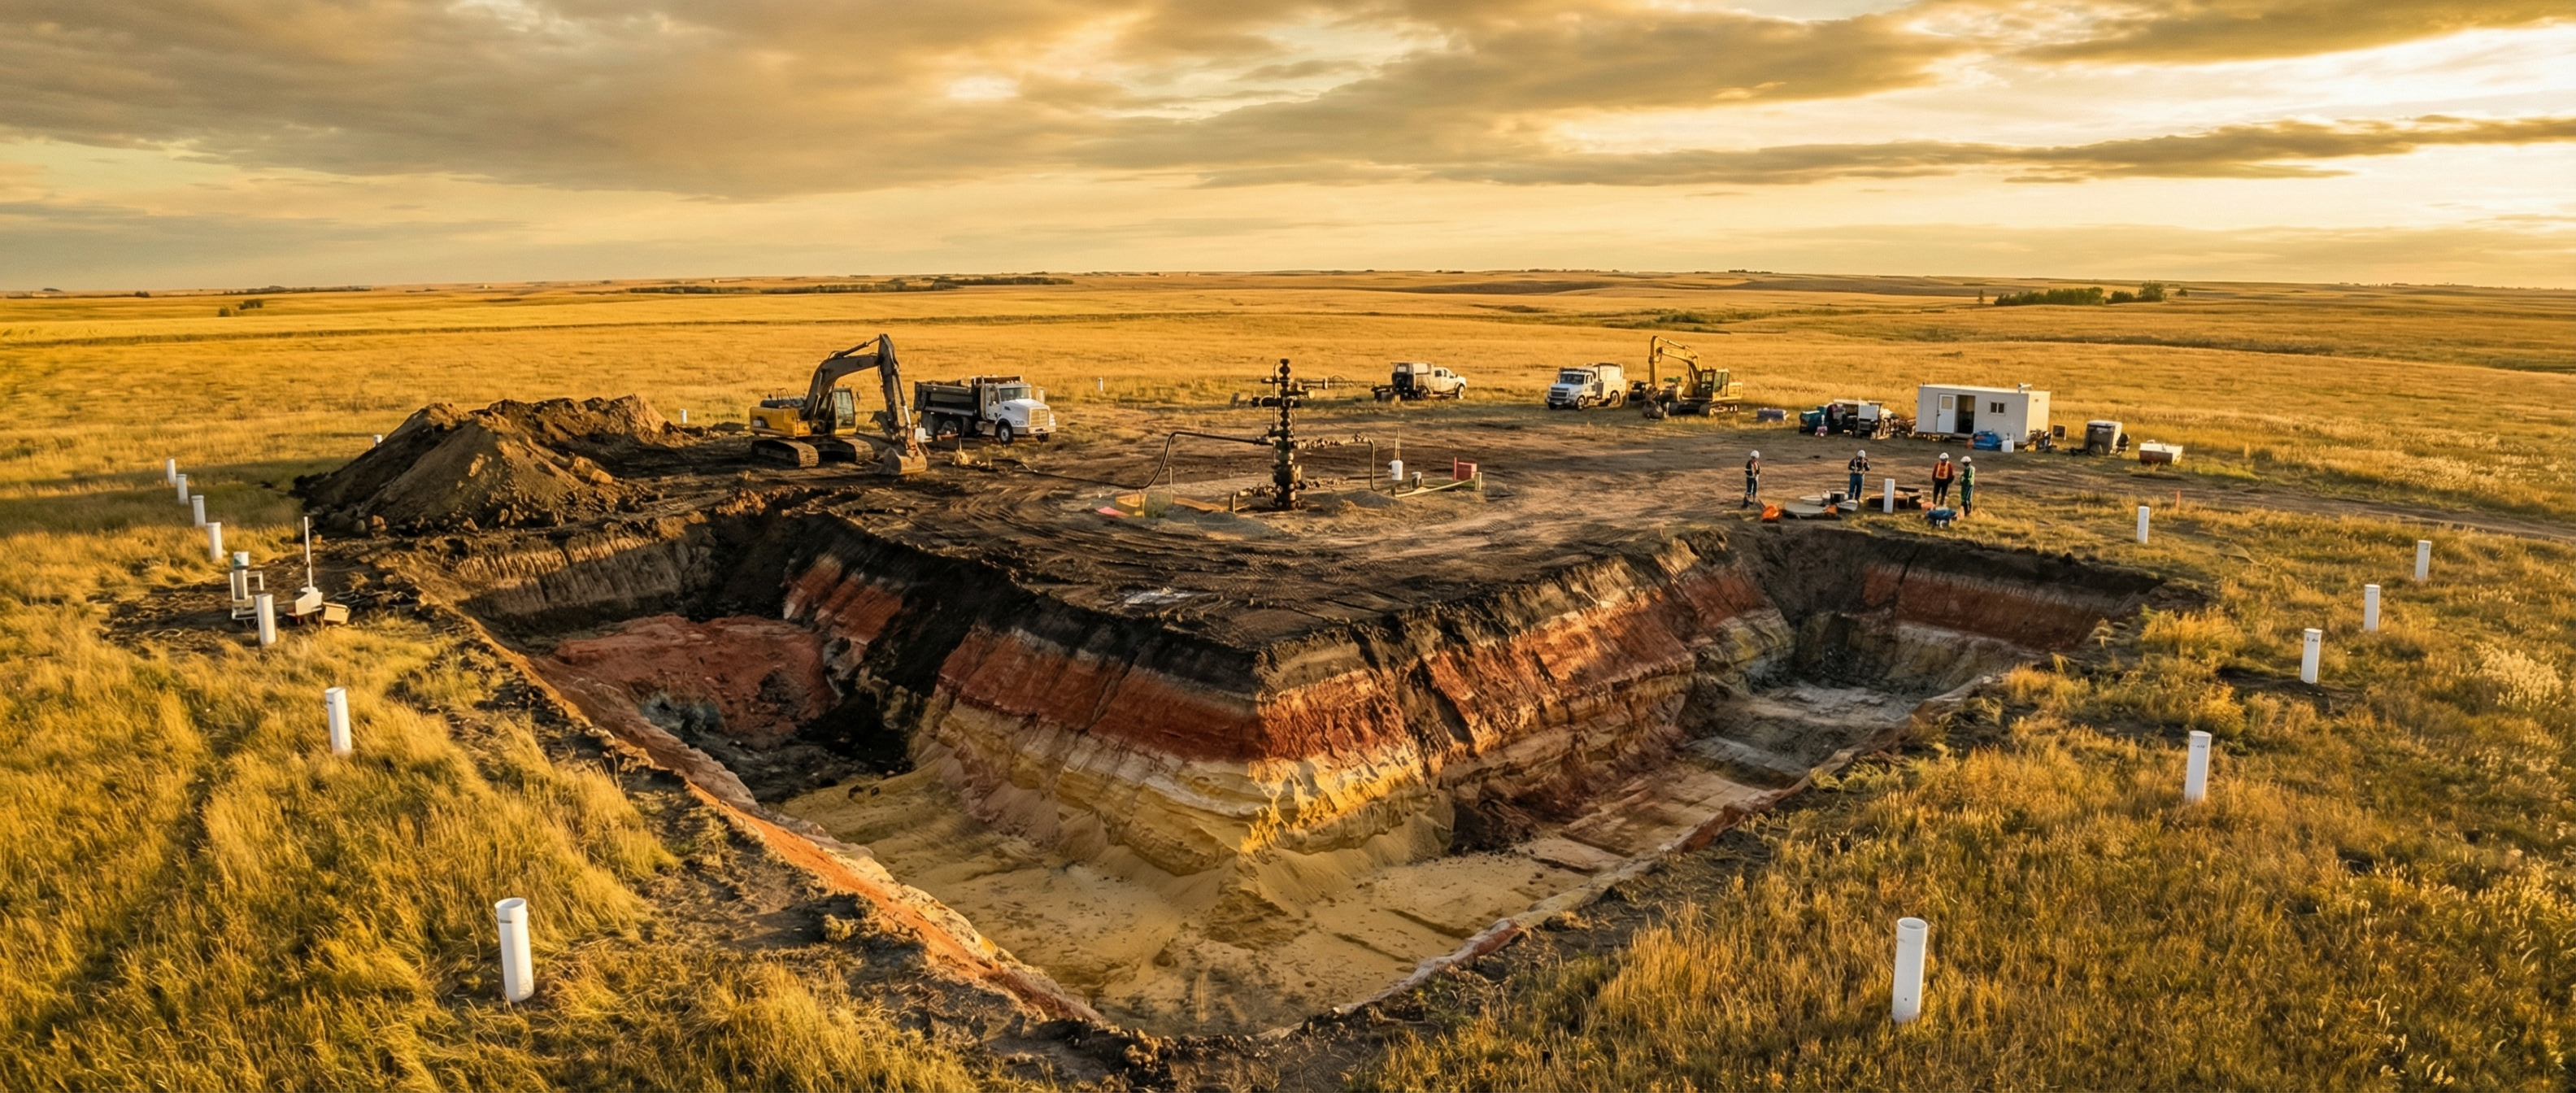
Calculating Excavation Volumes from Plume Contours — Without ArcGIS
Remediation cost-scoping starts with one number: how many cubic metres of impacted soil. Here's how to get that number from contoured analytical data inside Excel — no GIS license, no consultant intermediary.
Read article →
Background, Tier 1, Tier 2A: A Practical Guide to Alberta's Three-Tier Soil Framework
Tier 1 is generic. Tier 2A is pathway-modified. Background is what's actually under your site. Knowing which to apply — and how the three interact — is the difference between a defensible closure and a re-opened file.
Read article →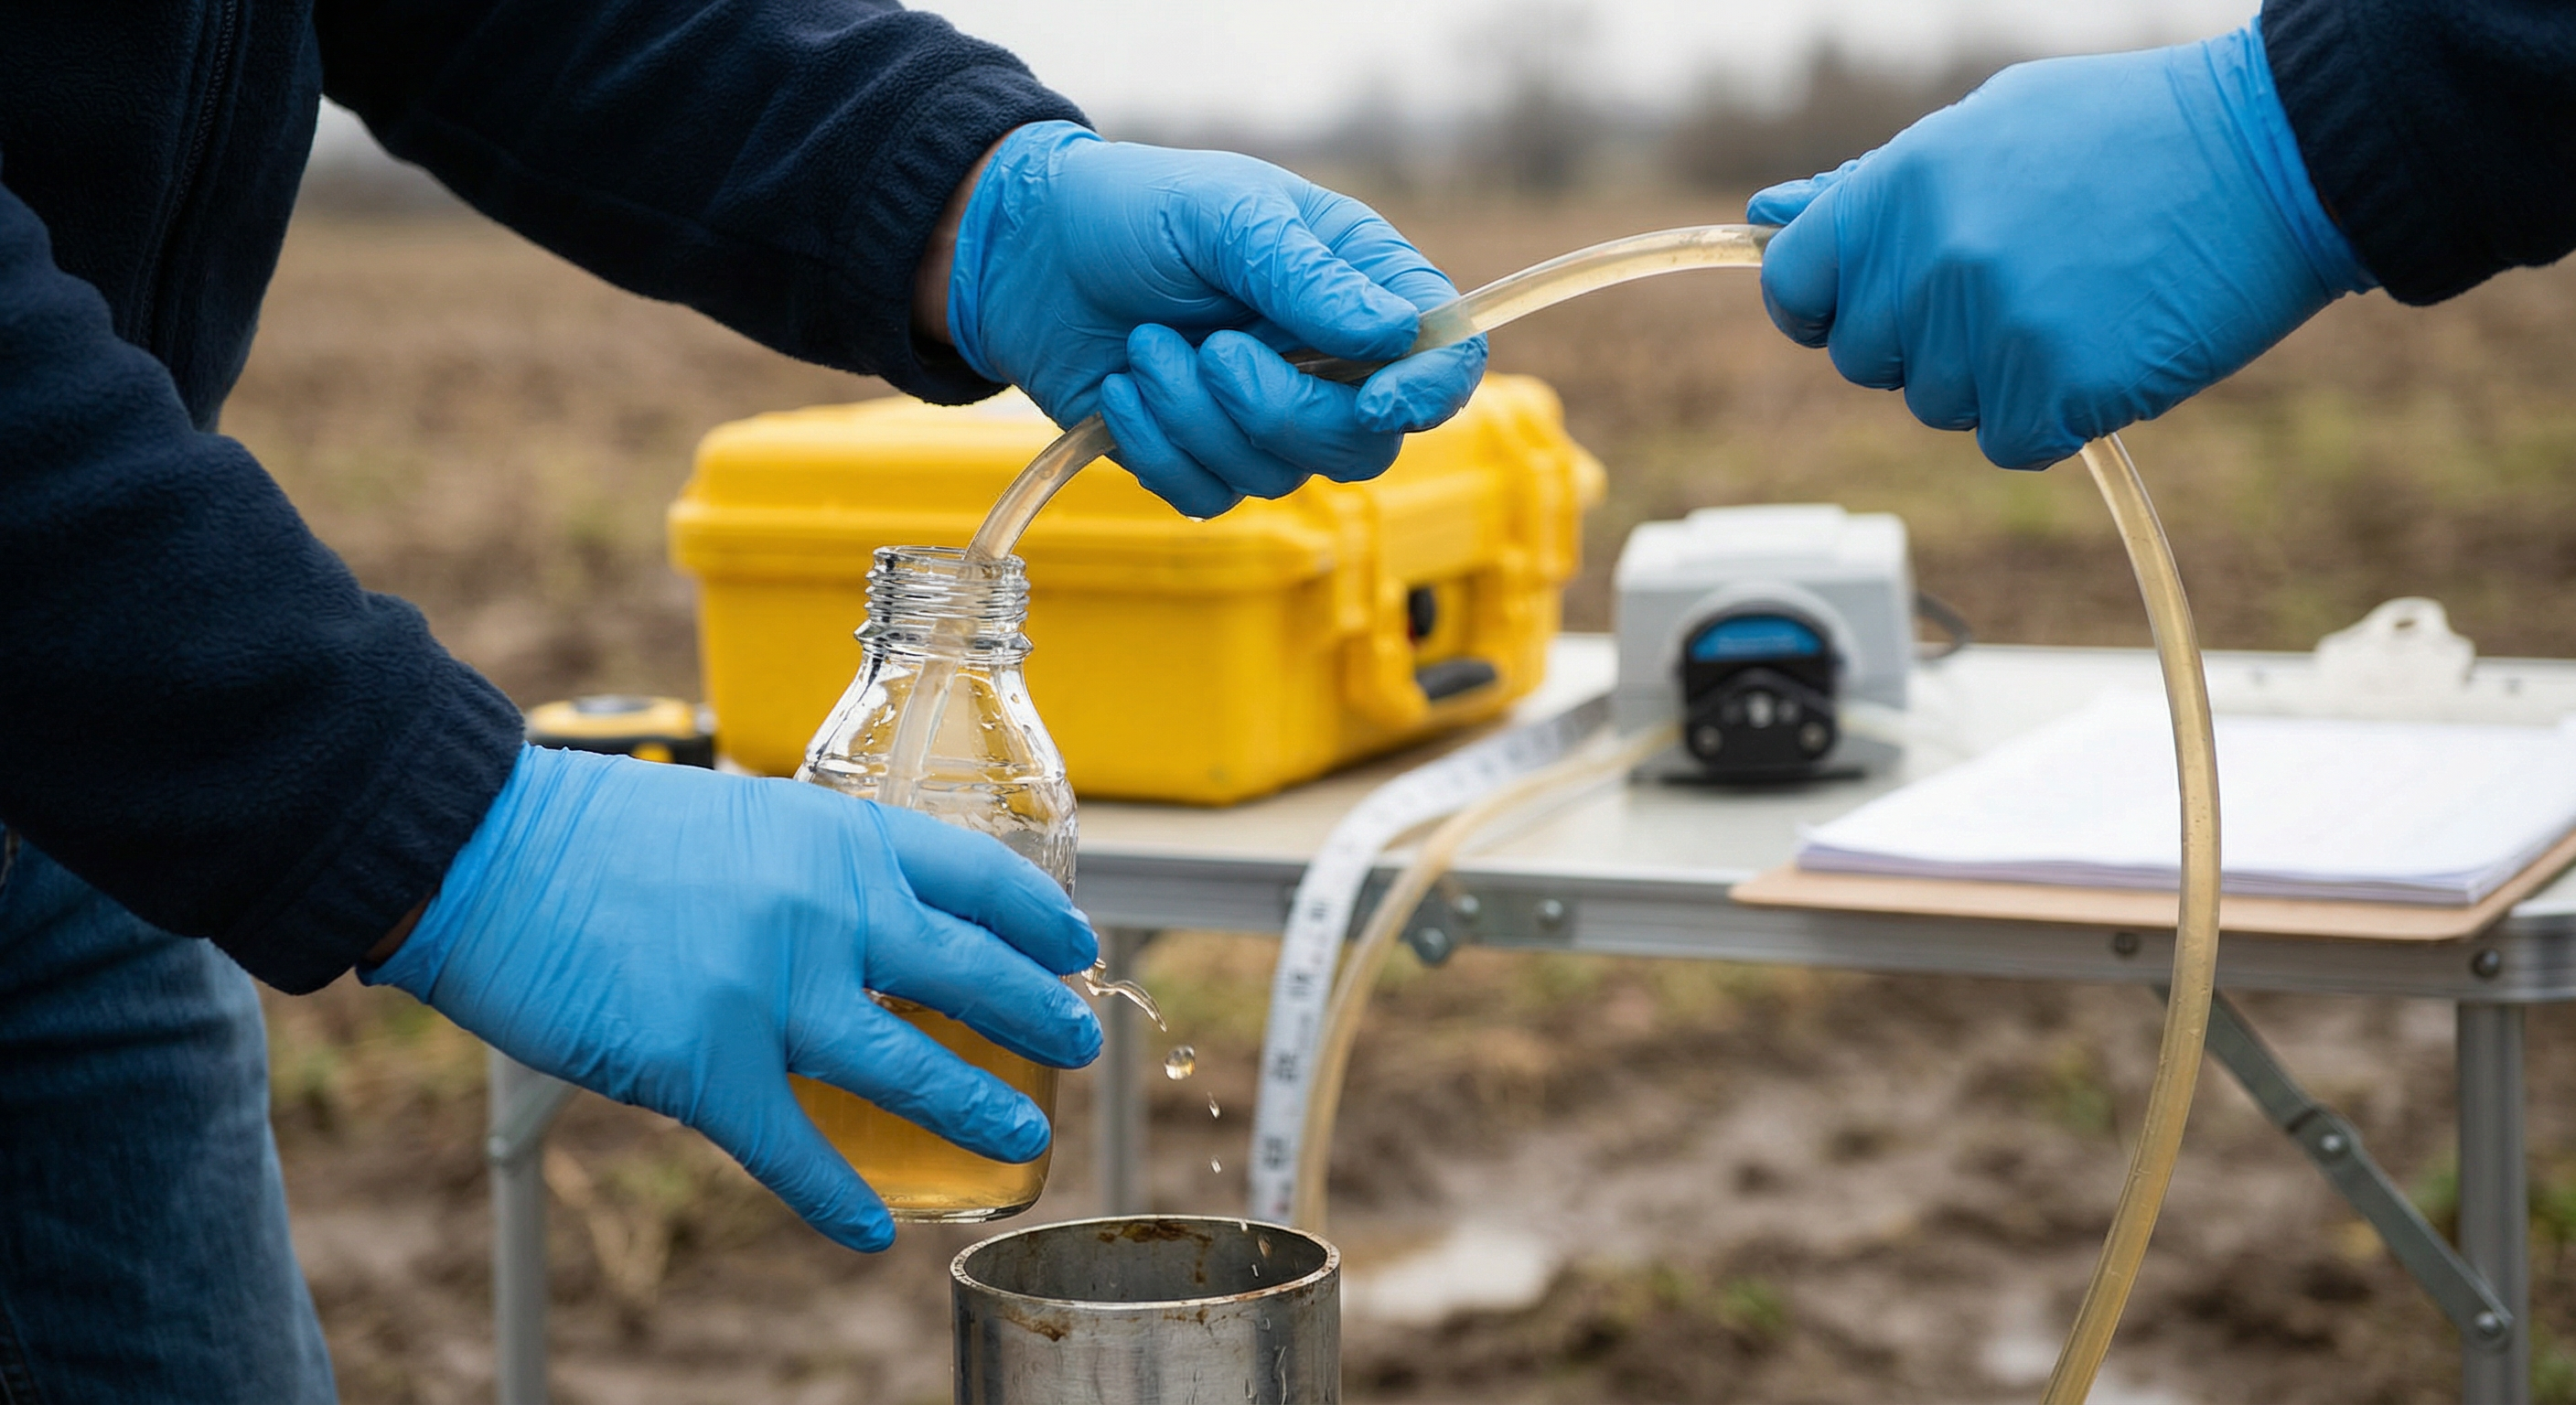
From PCE to Ethene: Tracking Chlorinated Solvent Natural Attenuation in Excel
Reductive dechlorination tells a story — if you can read it. Walk the PCE → TCE → cis-DCE → VC → Ethene chain on your own data and see what your monitoring network is actually telling you about biodegradation.
Read article →
Why Manual Exceedance Checking is Costing Your Firm Time and Credibility
You've got 47 parameters across 12 monitoring wells, each compared against land-use-specific guidelines. Here's why spreadsheets aren't cutting it anymore -- and what automated flagging actually looks like in practice.
Read article →
The Anatomy of a Phase II ESA: What Every Junior Consultant Should Know
From borehole drilling to lab analysis -- a practical walkthrough of the Phase II Environmental Site Assessment process, the data it generates, and why getting the analysis right matters more than most people think.
Read article →