If you're new to environmental consulting -- or just want a refresher on the process -- the Phase II Environmental Site Assessment (ESA) is one of the most important tools in the remediation toolkit. It's where the science meets the soil, and where the data you collect determines whether a site gets a clean bill of health or triggers a full-scale remediation program.
What is a Phase II ESA?
A Phase II ESA is an intrusive investigation designed to confirm or deny the presence of contamination at a site. It typically follows a Phase I ESA (a desktop and walkthrough study) that has identified potential areas of environmental concern (APECs).
Where a Phase I asks "could there be contamination here?", a Phase II asks "is there actually contamination, where exactly is it, and how bad is it?"
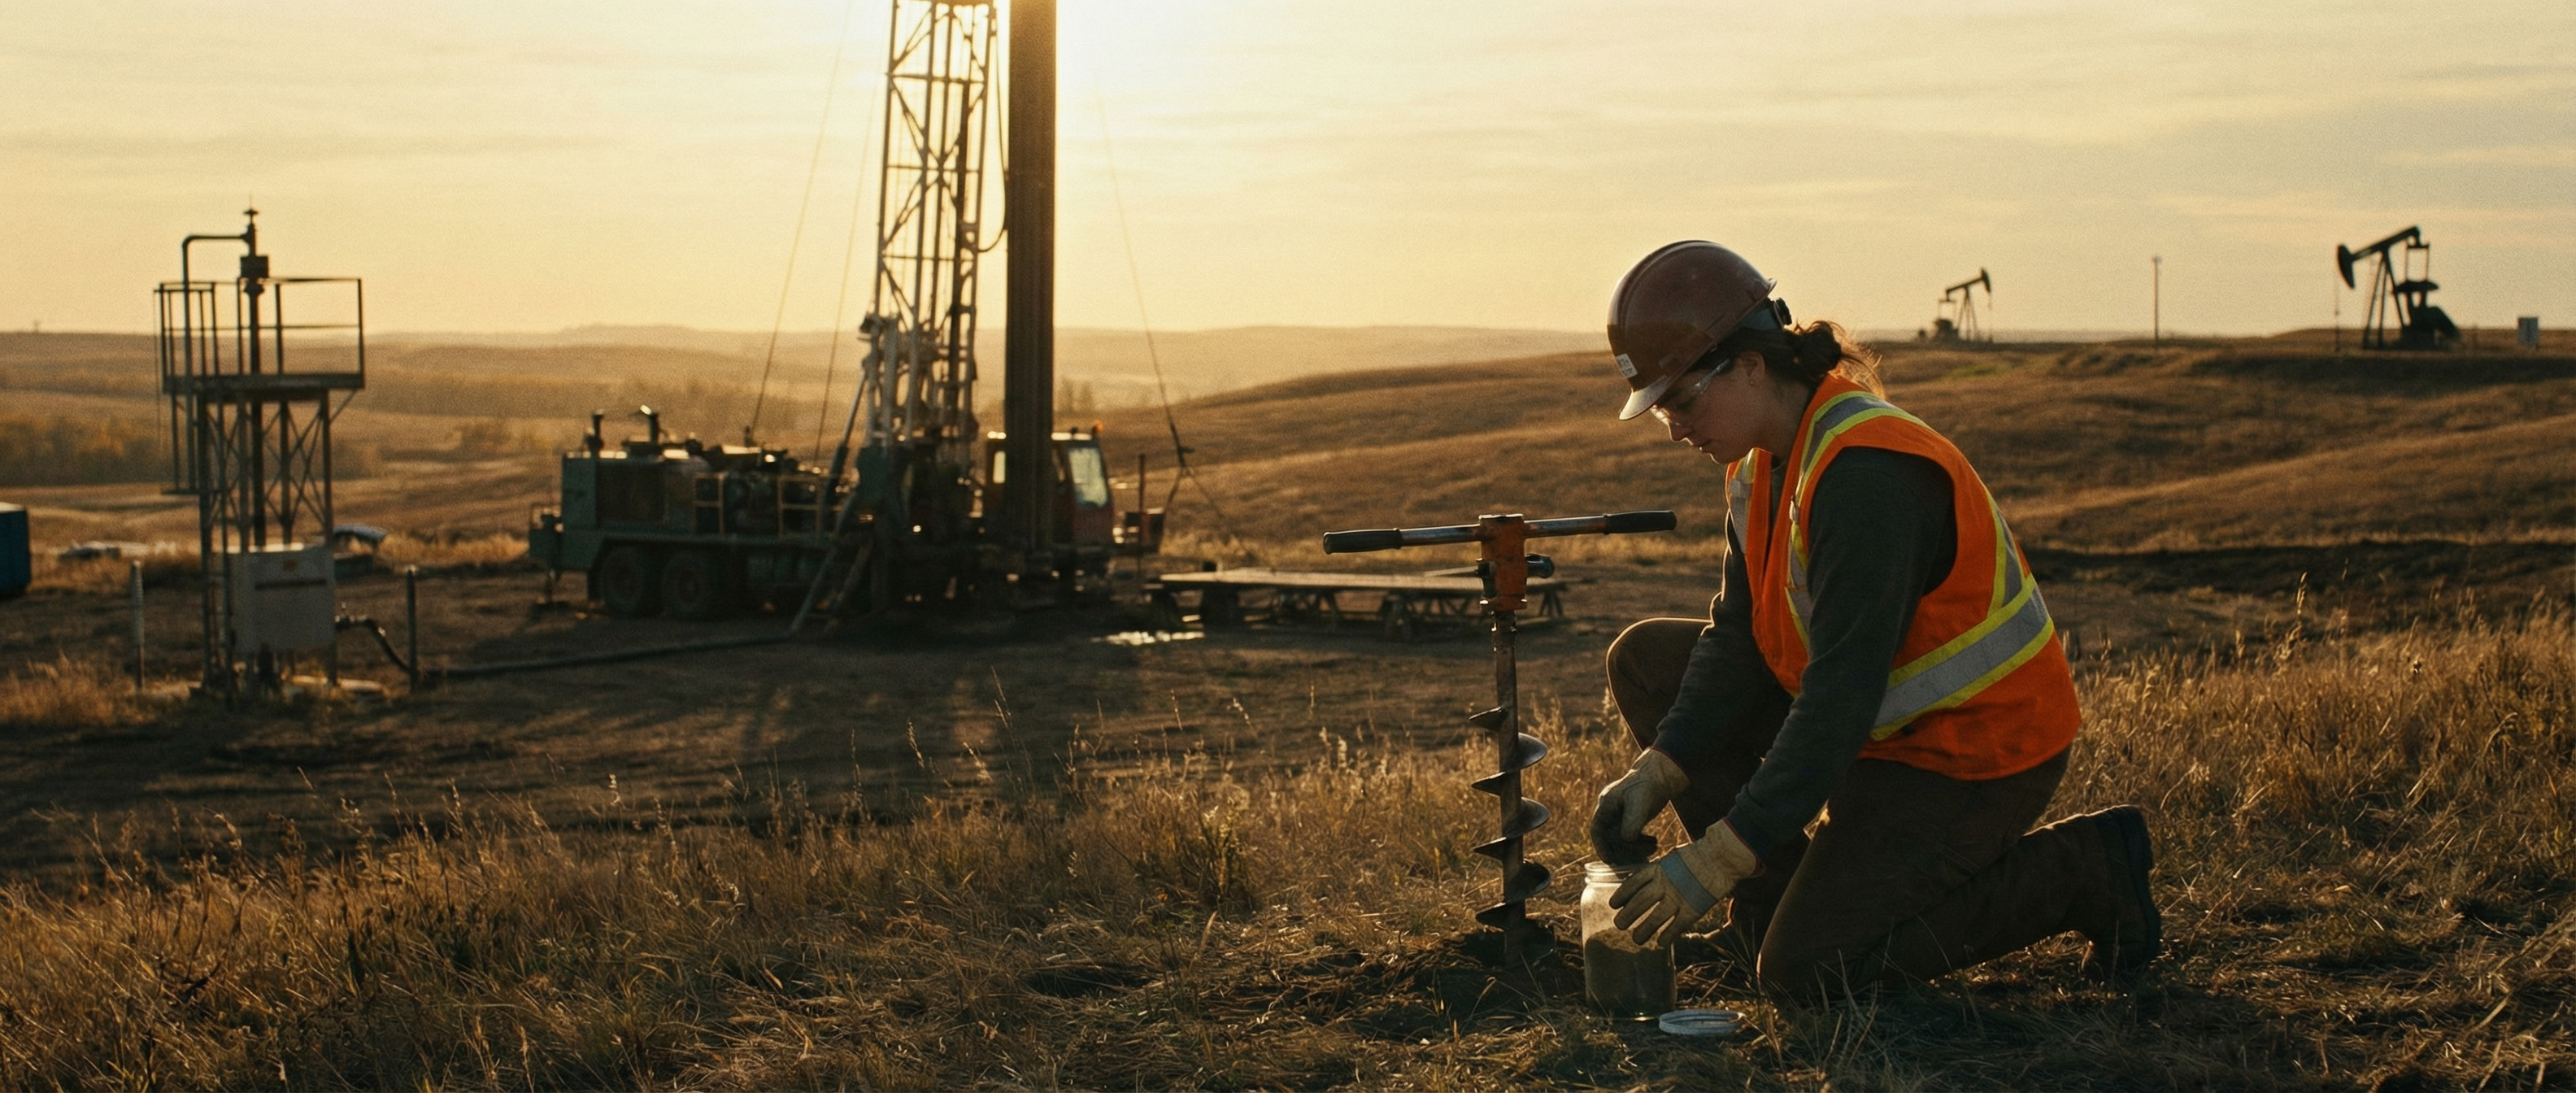 Field technician collecting soil samples at an oil well remediation site in Western Canada.
The Investigation Process
1. Planning & Borehole Layout
Before any drill hits the ground, the investigation team develops a sampling plan. This plan is based on the findings of the Phase I, site geology, the suspected contaminants of concern (COCs), and applicable regulatory guidelines.
Key decisions at this stage include:
- Borehole locations -- typically placed around known or suspected sources of contamination (former tank farms, wellheads, flare pits, sumps)
- Sampling depths -- determined by soil stratigraphy and the expected depth of contamination
- Analytical parameters -- which chemicals to test for (PHCs, BTEX, metals, salinity, glycols, etc.)
- Monitoring well placement -- to assess groundwater quality downgradient of potential sources
2. Drilling & Soil Sampling
The drill rig arrives on site and begins advancing boreholes to the target depths. As the auger or core barrel is extracted, the geologist or environmental technician logs the soil -- noting texture, colour, moisture, odour, and any visual evidence of contamination (staining, sheens, strong hydrocarbon odours).
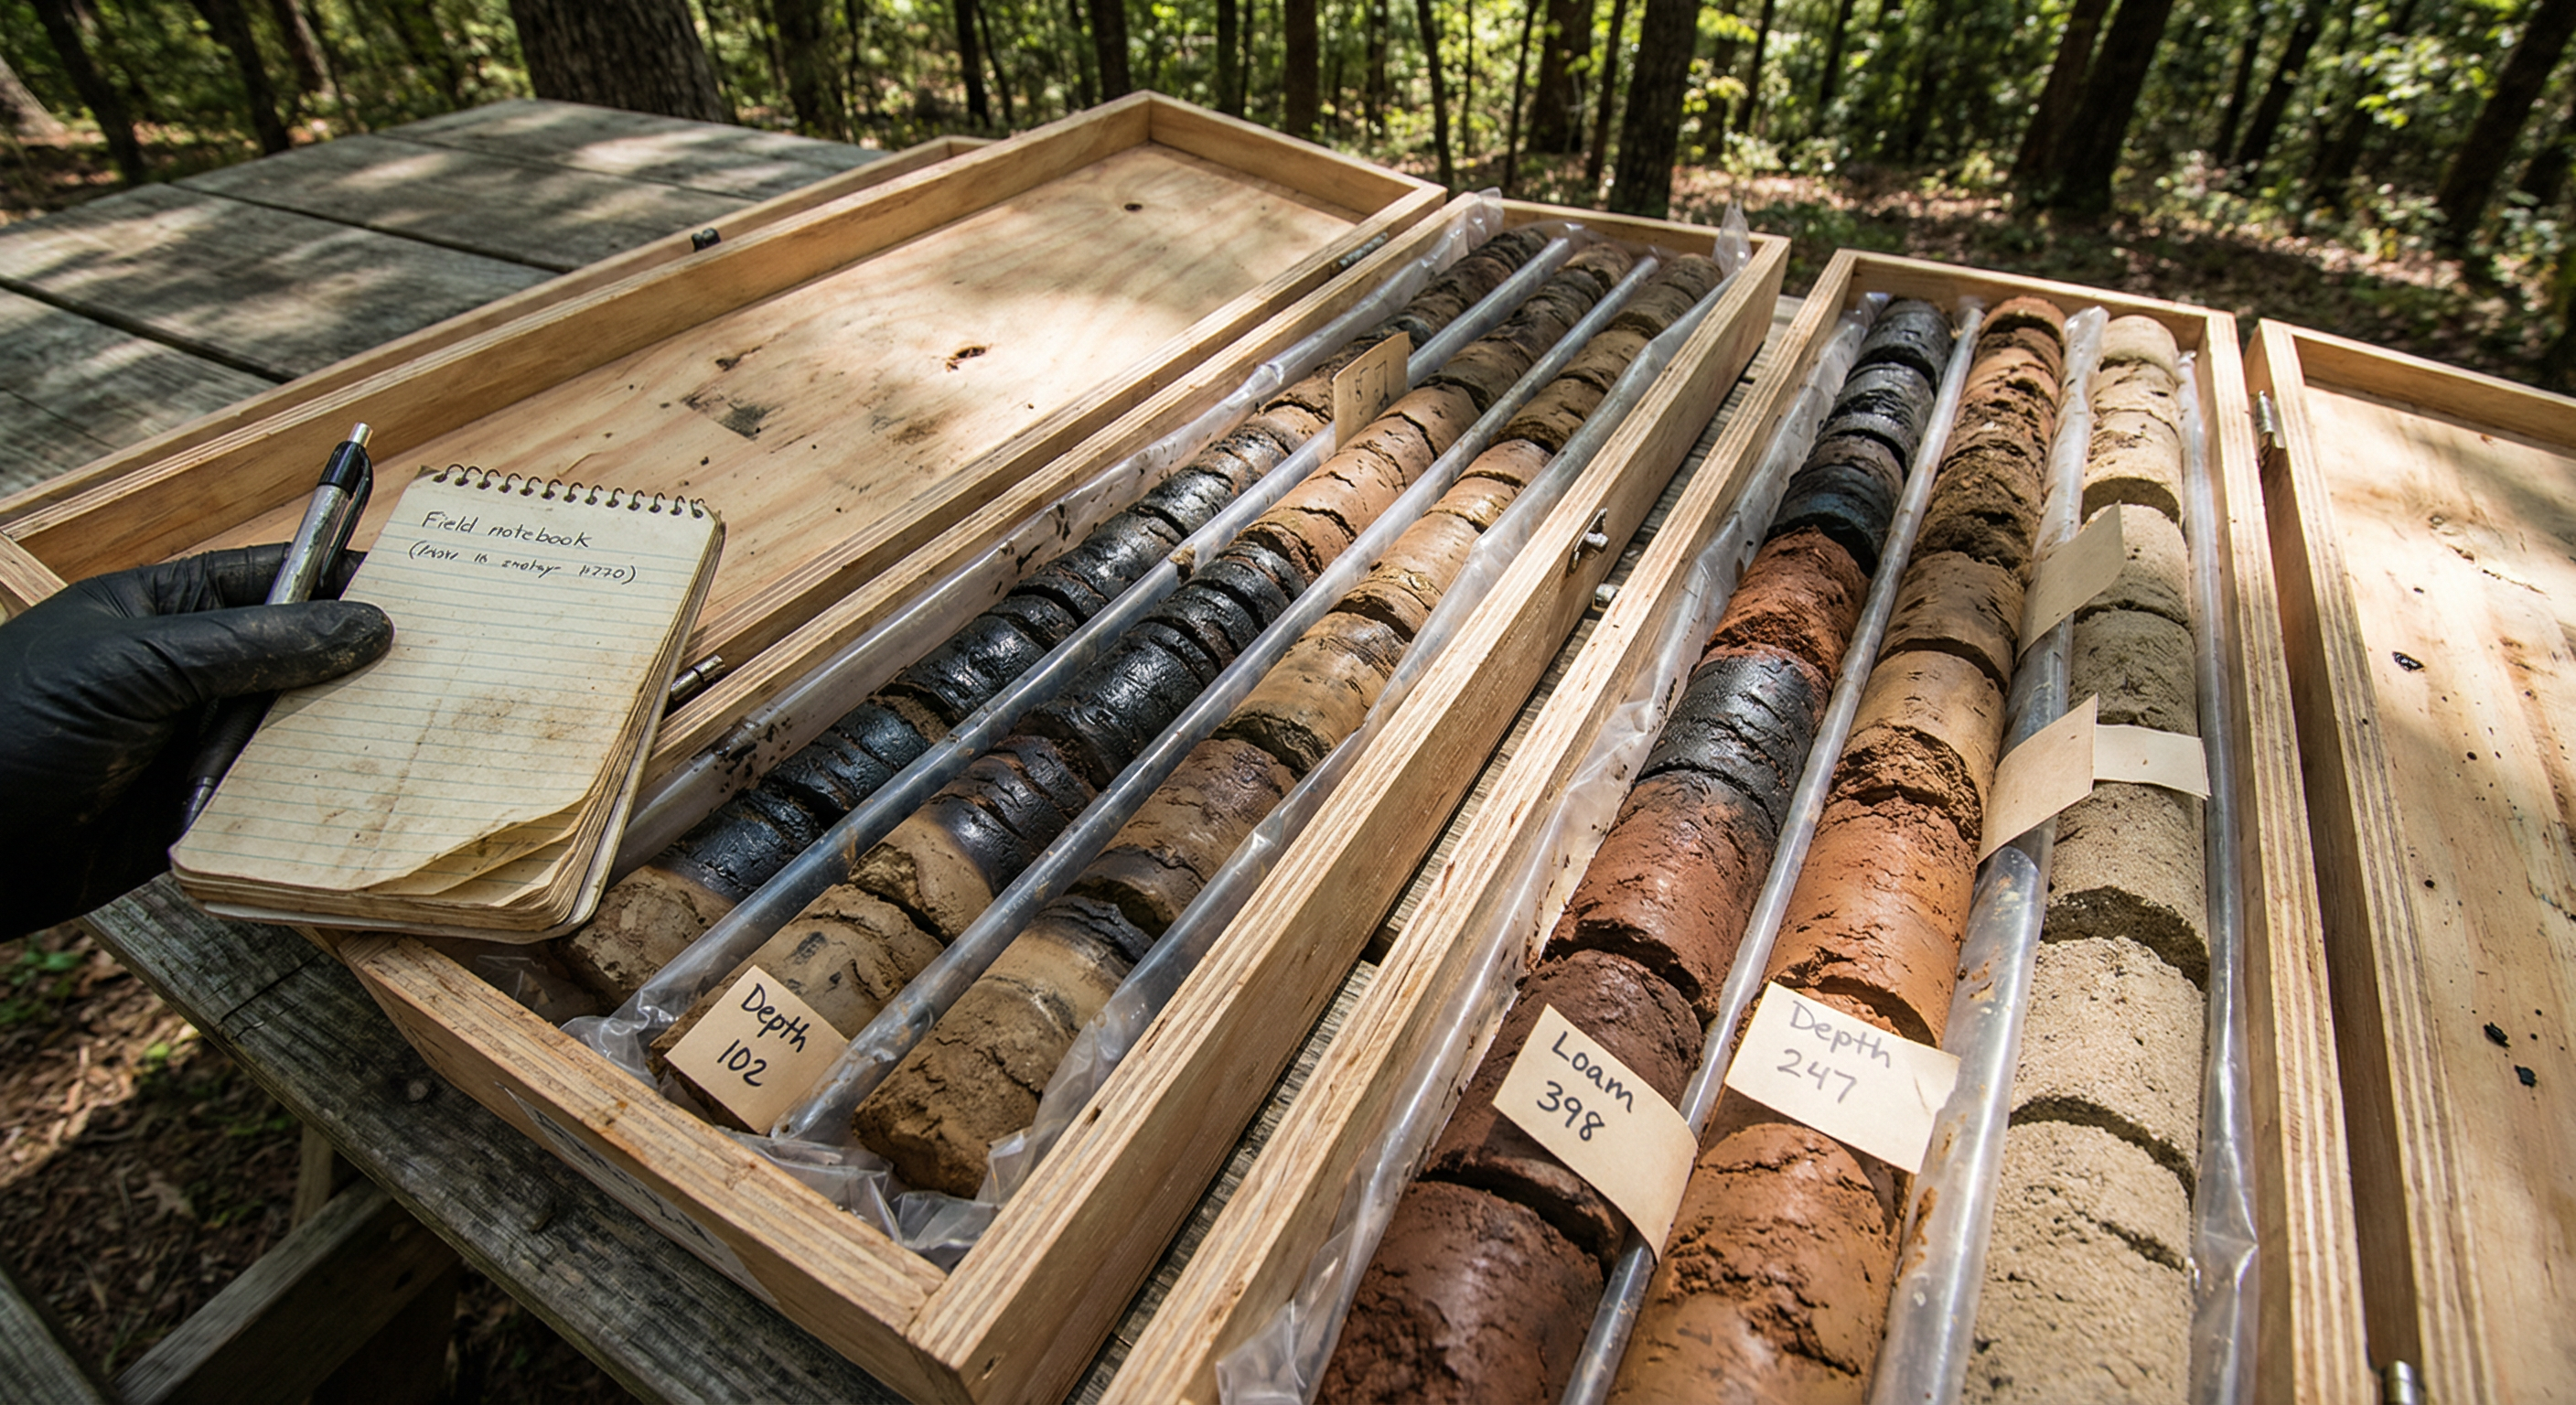 Soil core samples laid out for logging. Note the visible colour changes between clean and potentially impacted intervals.
Soil samples are collected at specific intervals and placed into lab-provided containers (jars, bags, VOA vials). Chain of custody documentation tracks every sample from the field to the lab -- a critical link in the defensibility chain.
3. Groundwater Sampling
If the investigation plan includes groundwater, monitoring wells are installed at select borehole locations. These are typically PVC-screened wells that allow groundwater to flow in for sampling.
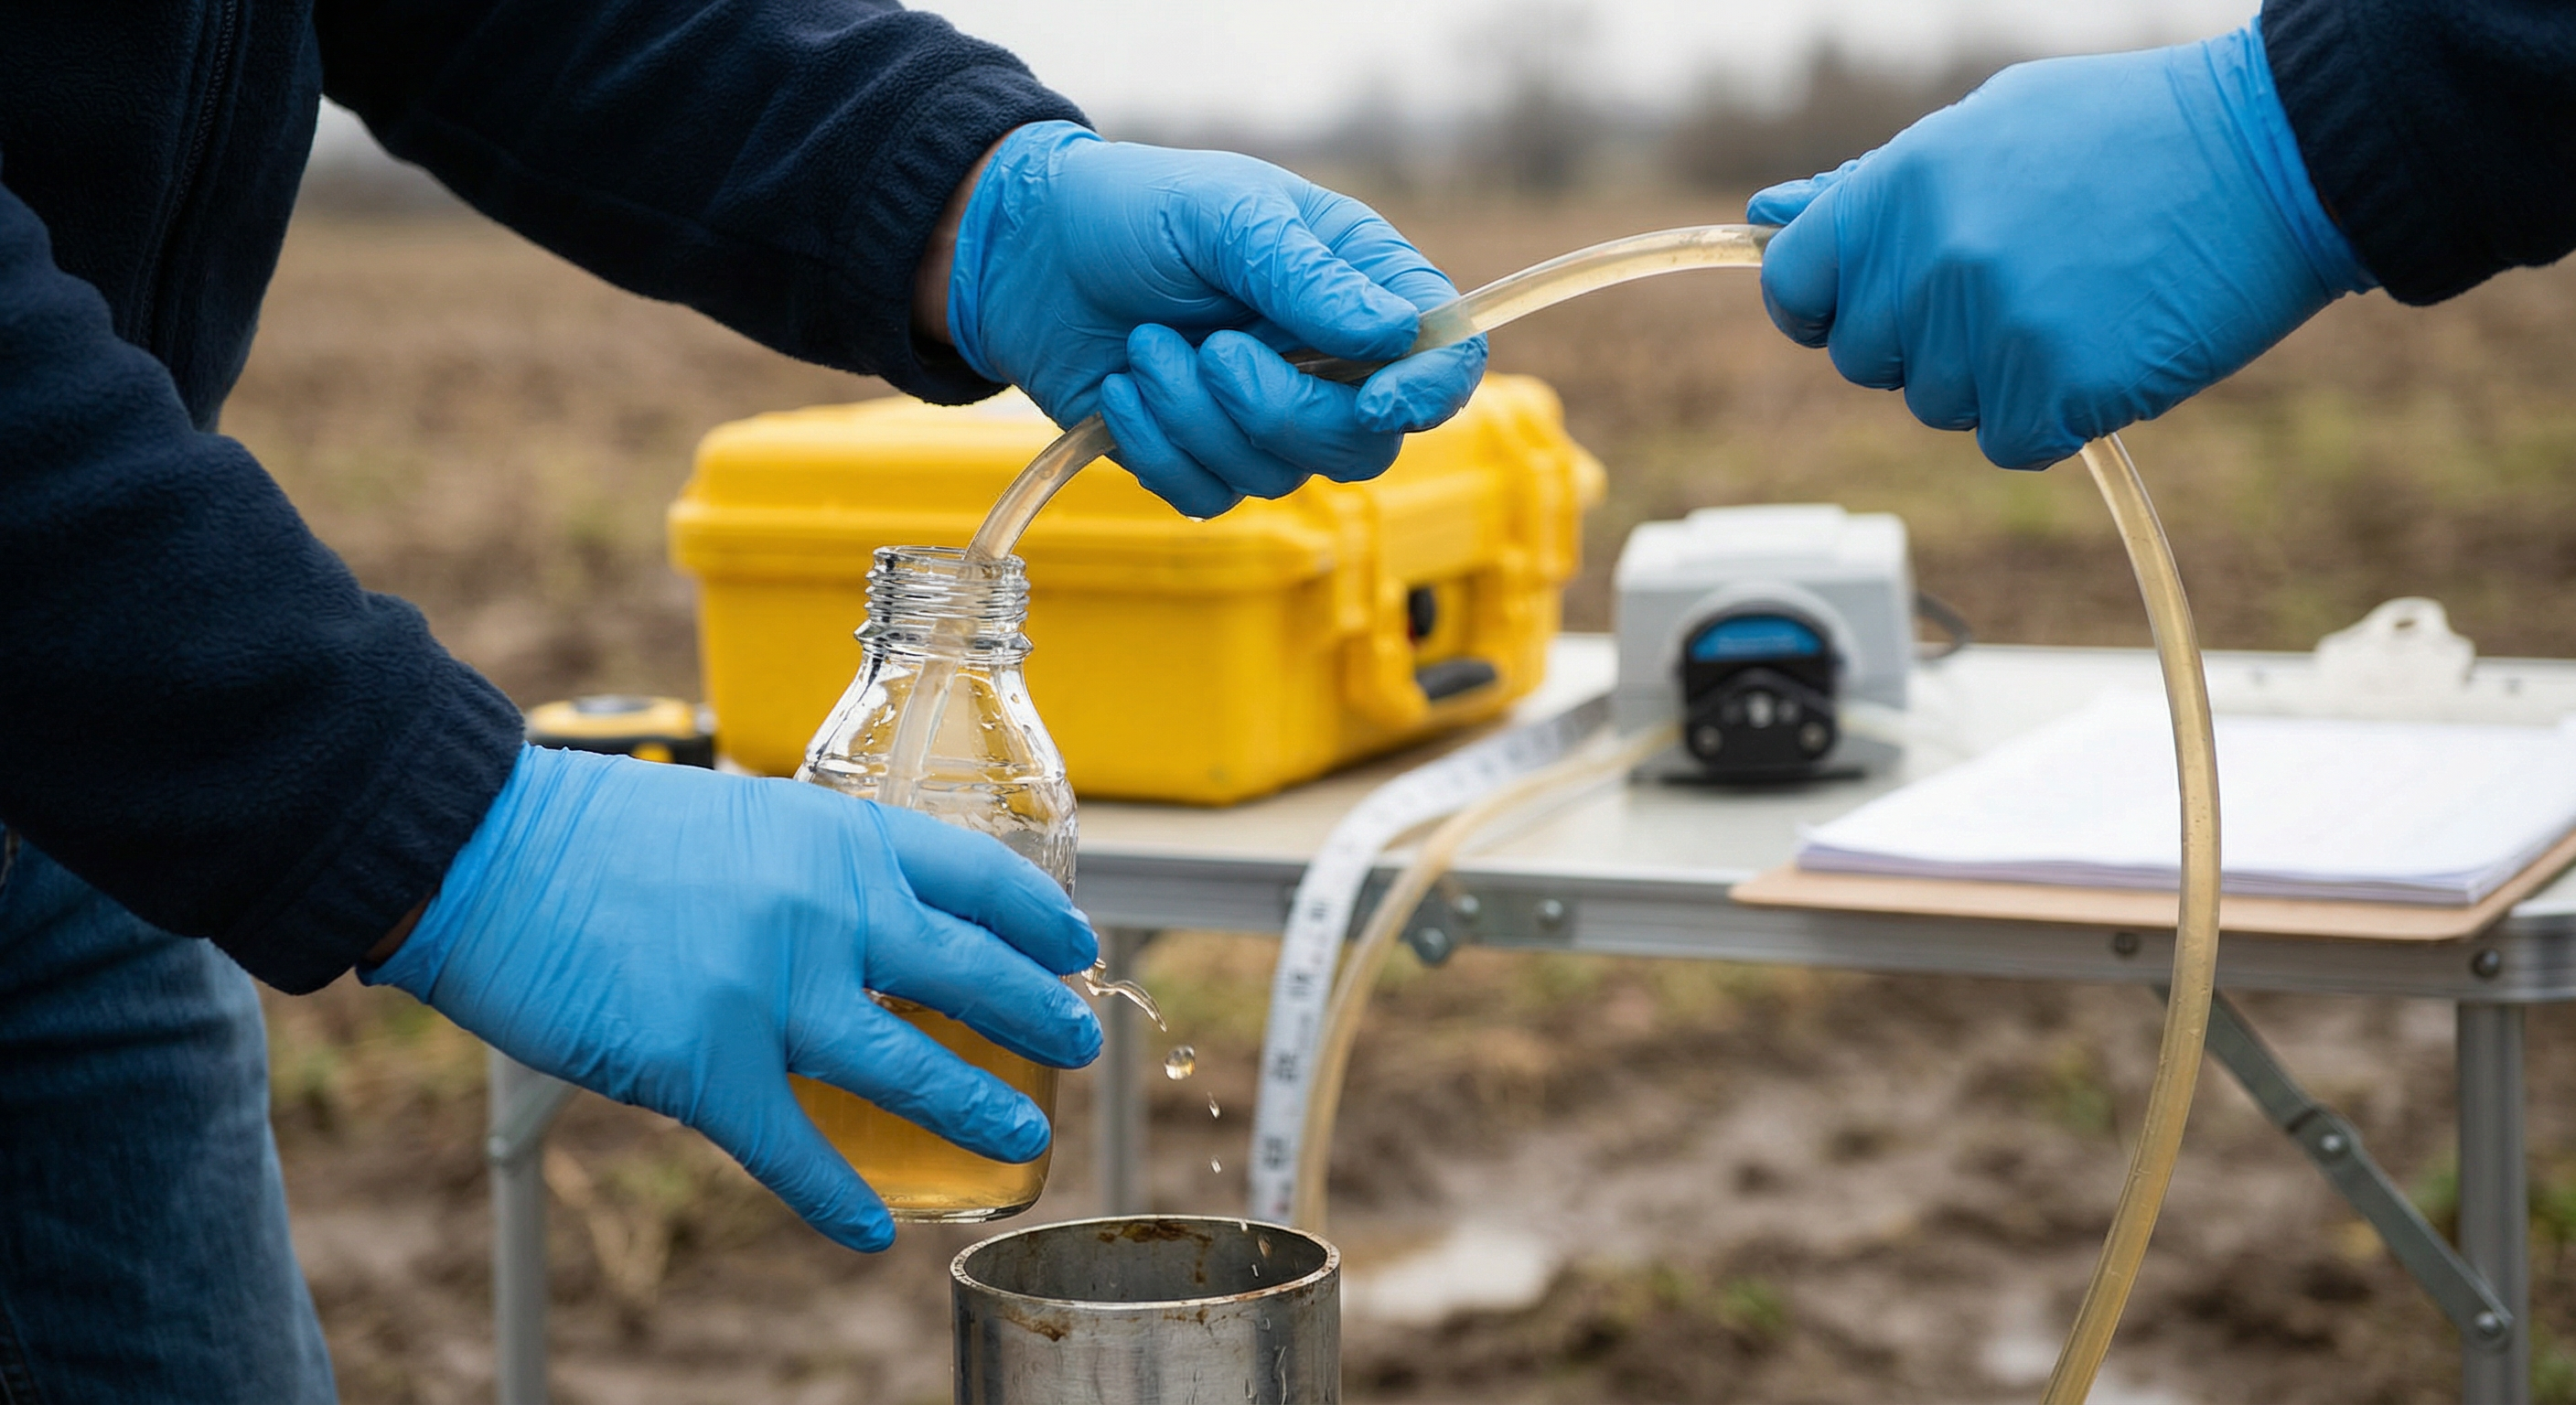 Groundwater sampling using a peristaltic pump. Water quality parameters (pH, conductivity, temperature) are measured in the field.
After a well is developed and stabilized, the technician purges the well and collects groundwater samples. Field parameters like pH, electrical conductivity, dissolved oxygen, and temperature are measured in real-time to confirm the sample is representative of the aquifer.
4. Laboratory Analysis
Samples are shipped to an accredited laboratory under strict chain of custody protocols. The lab runs the requested analyses -- which might include:
- Petroleum Hydrocarbons (PHCs) -- F1 through F4 fractions
- BTEX -- Benzene, Toluene, Ethylbenzene, Xylenes
- Metals -- Lead, arsenic, cadmium, chromium, and more
- Salinity indicators -- Sodium, chloride, SAR, electrical conductivity
- Glycols & other site-specific COCs
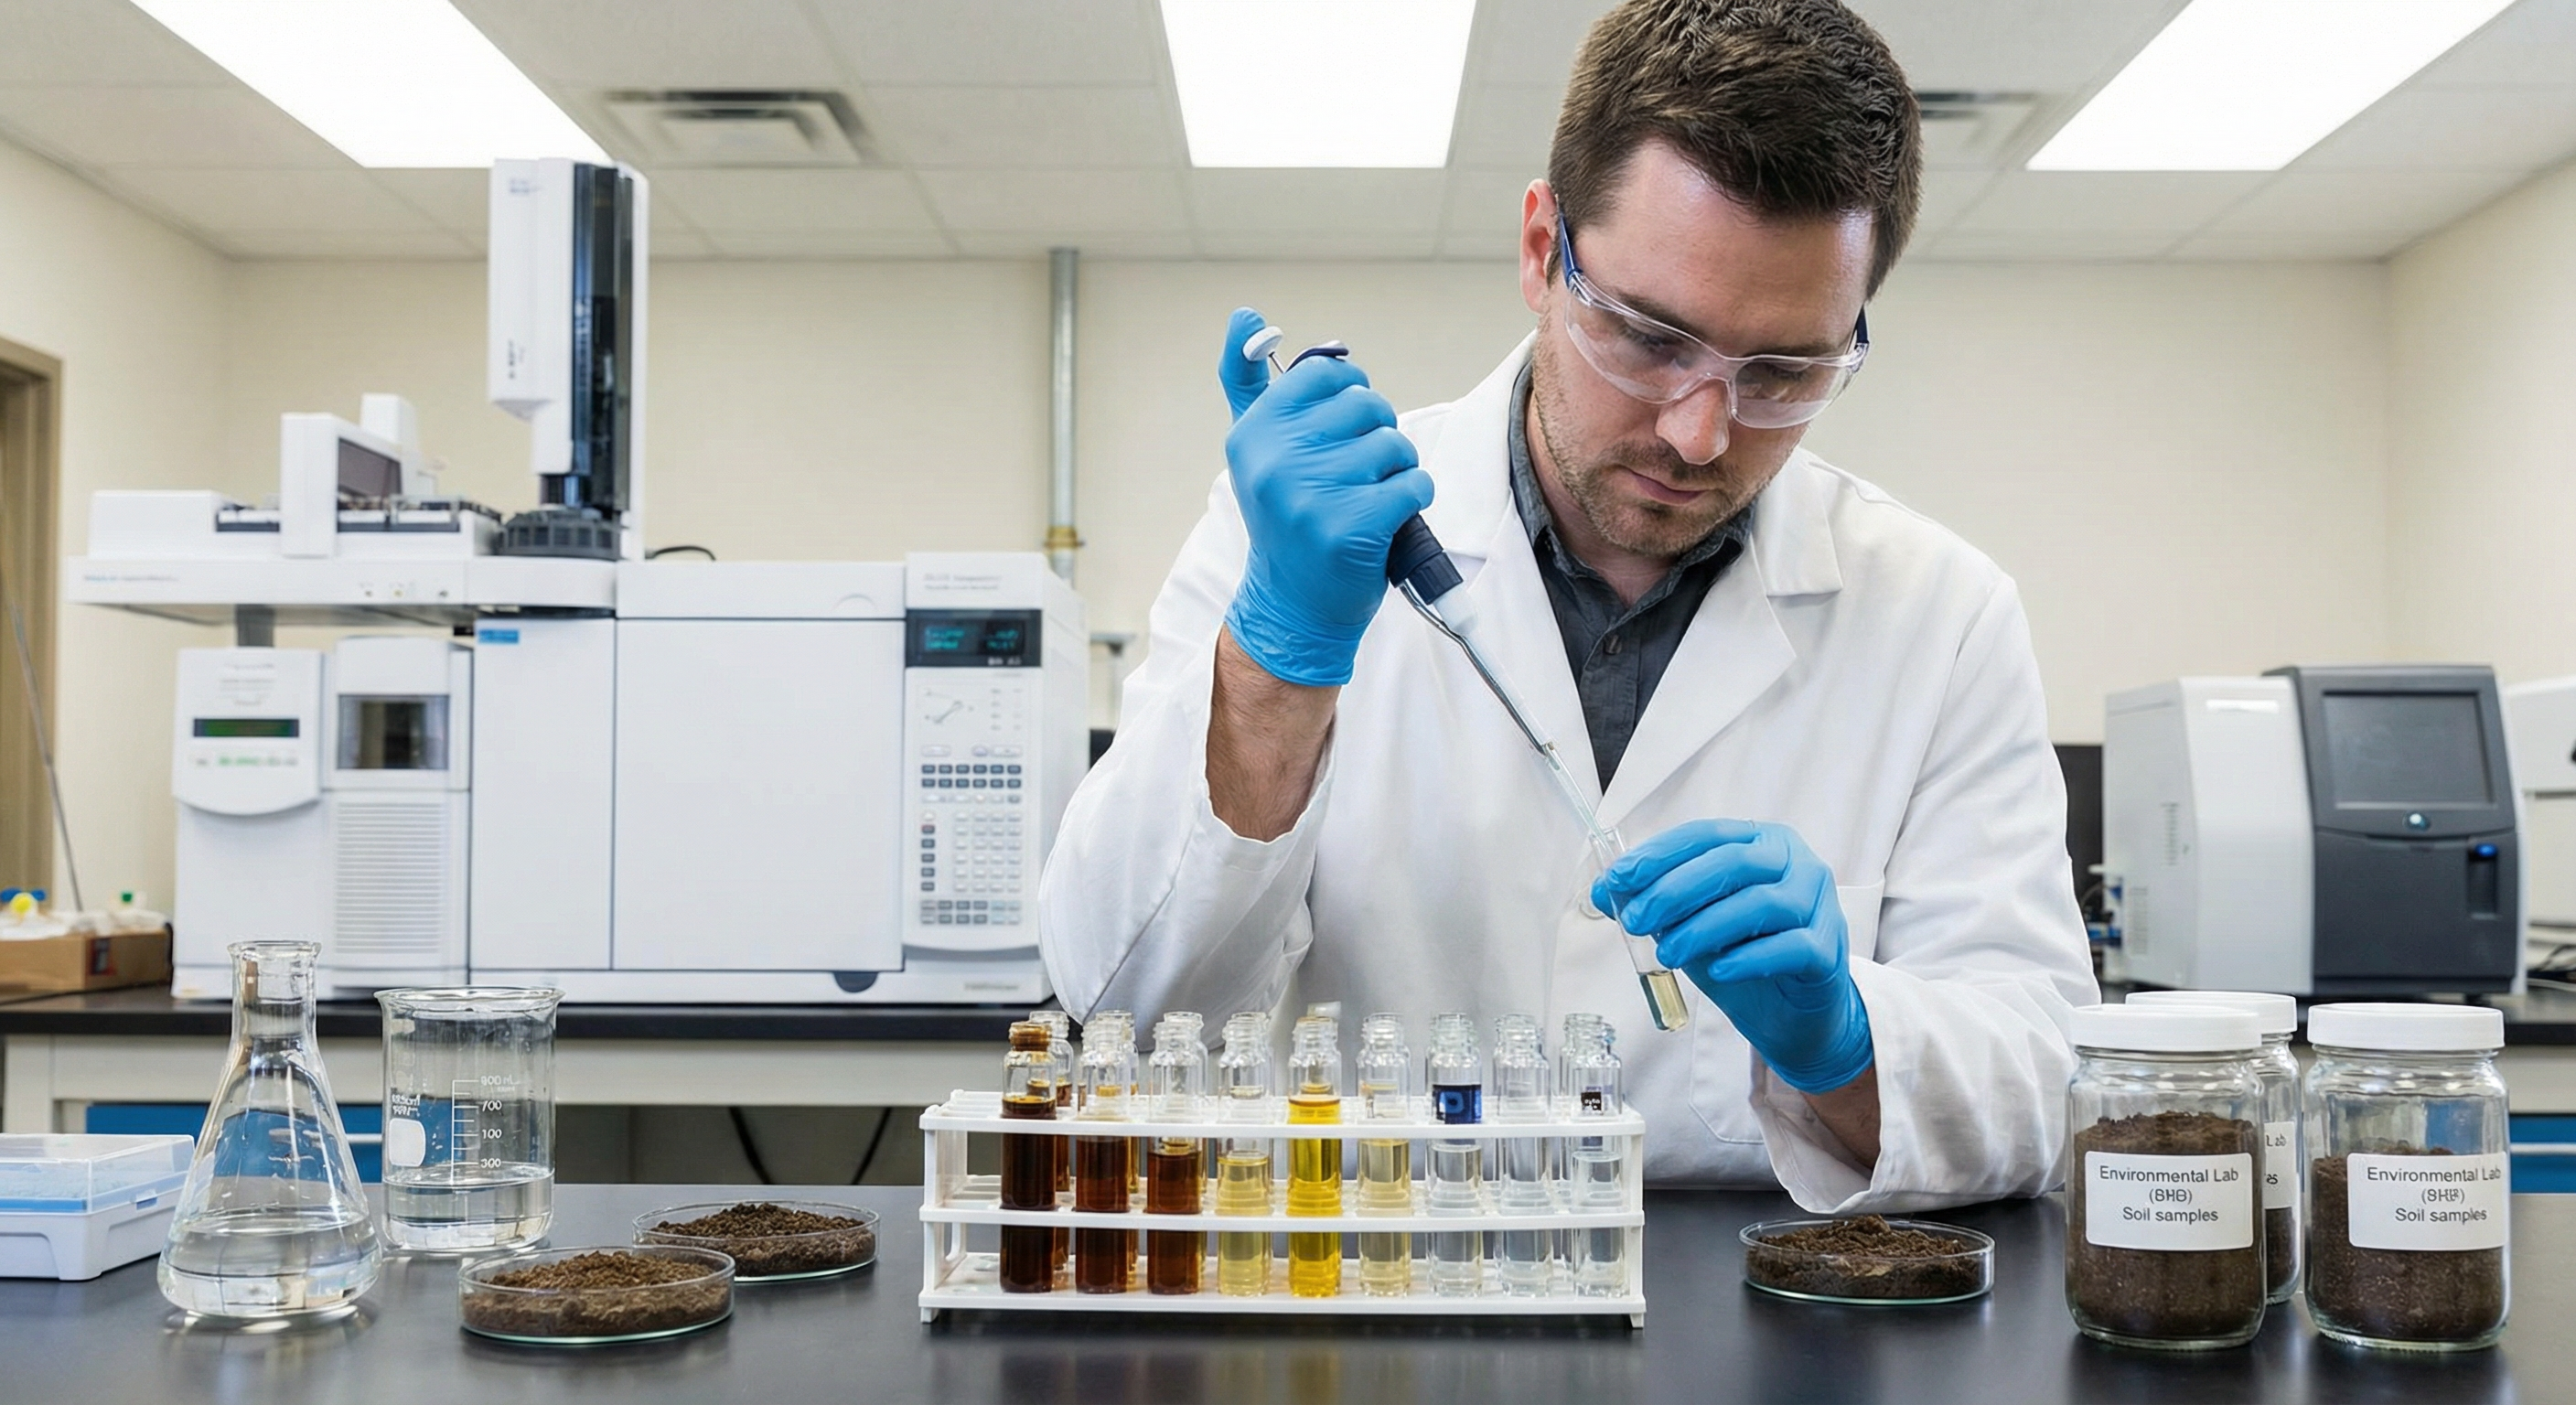 Lab analysis of soil and water samples. The gas chromatograph (background) identifies and quantifies individual chemical compounds.
Where the Data Gets Complicated
Here's where many projects start to slow down. The lab sends back results -- often hundreds of data points across dozens of samples, multiple media, and various analytical suites. The consultant now needs to:
- Validate the data -- check for QA/QC flags, duplicate consistency, detection limits
- Compare against guidelines -- match each parameter/media/land-use combination to the correct Tier 1 guideline value
- Flag exceedances -- identify which results exceed applicable criteria
- Interpret spatially -- determine the lateral and vertical extent of contamination
- Report defensibly -- present findings in a way that meets regulatory expectations
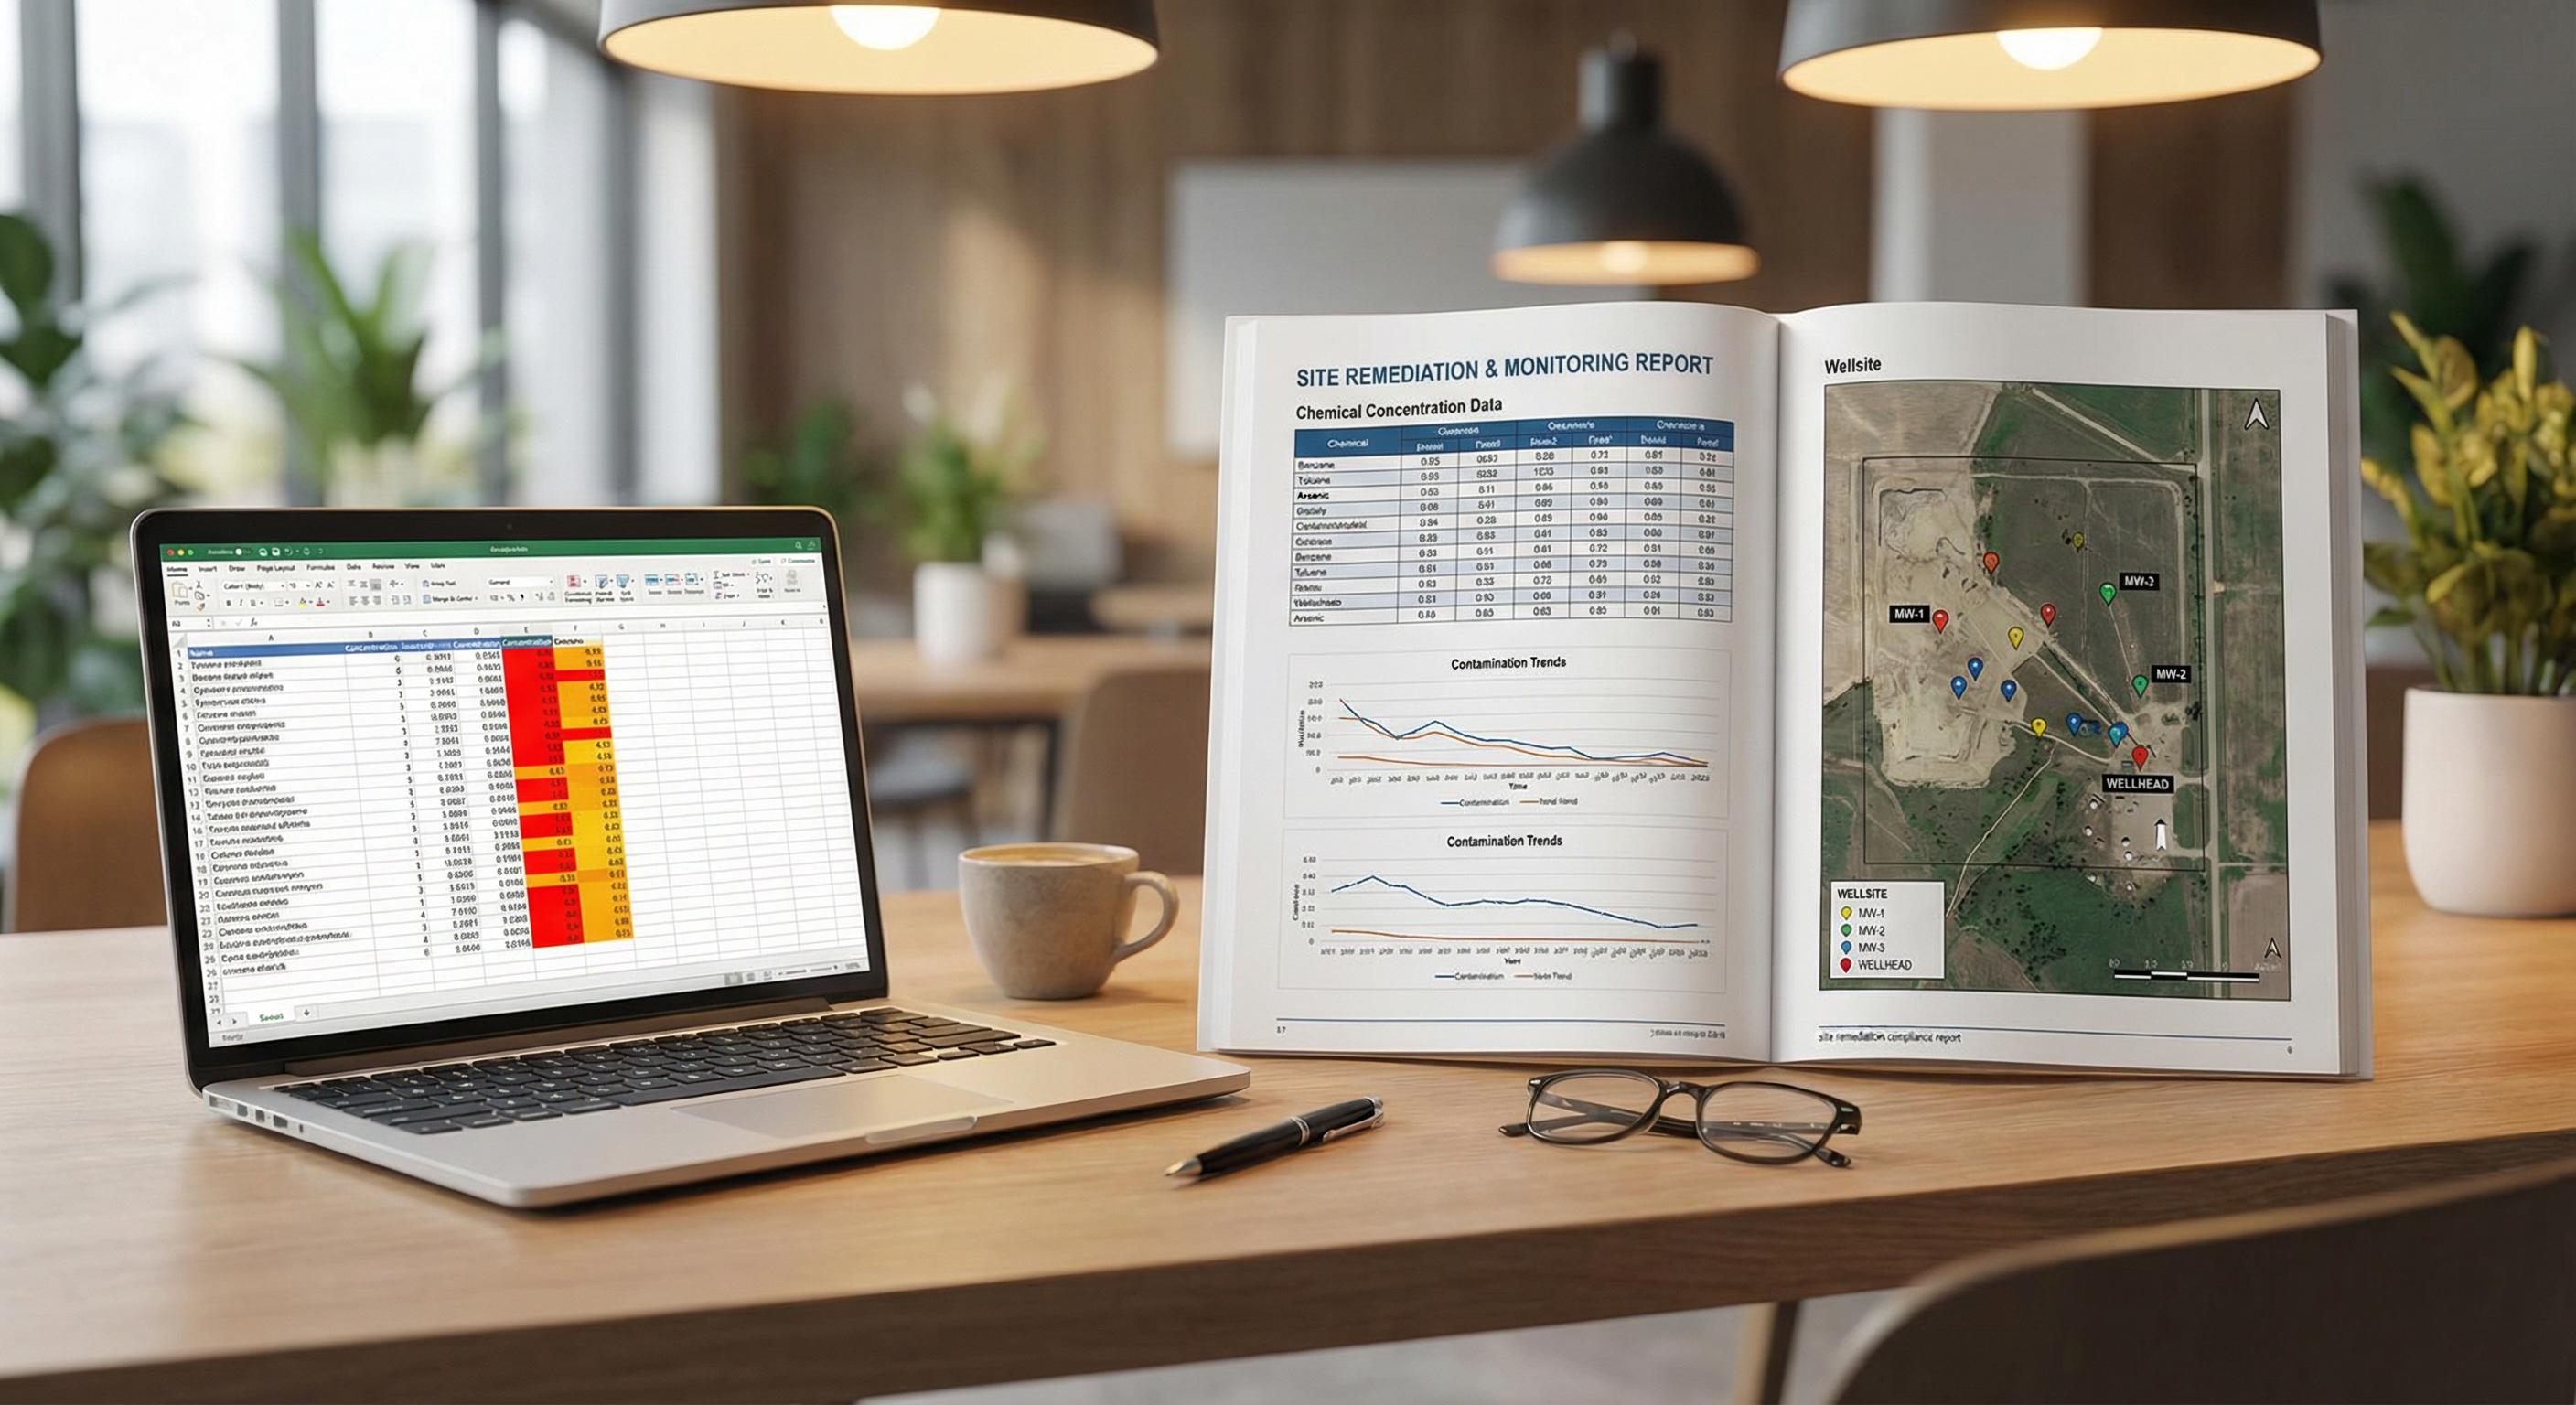 The consultant's reality: lab data in Excel, exceedance flags in red, and a compliance report to write -- all under deadline pressure.
This is traditionally done in Excel. And if you've ever managed a multi-well site with 40+ parameters across soil and groundwater, you know how quickly it becomes a nightmare of VLOOKUPs, manual colour-coding, and copy-paste errors.
Where [GRYD] Fits In
This is exactly the bottleneck [GRYD] was built to eliminate. Instead of spending days manually cross-referencing lab data against guideline tables, [GRYD] automates the entire comparison process:
- Lab data is ingested and normalized automatically
- Chemical parameters are mapped to the correct guideline criteria based on media and land use
- Exceedances are flagged instantly with severity classification
- Reports are generated with audit-ready formatting
The result? What used to take 2-3 days of manual analysis can be completed in minutes -- with greater accuracy and a full audit trail.
Ready to Automate Your Phase II Reporting?
See how [GRYD] handles the data analysis your team is doing manually today.
Explore Features