Conversion Analysis
Lab data arrives messy — mismatched units, inconsistent analyte naming, salinity expressed five different ways, hydrocarbon fractions split across CWS and Tier 2A definitions, coordinates in everything from UTM to lat/long to local site grids. The Conversion Analysis engine normalizes all of it so the downstream screening, salinity, and spatial workflows run on clean, comparable data.
Module 1
Lab Analysis Scope & EDD
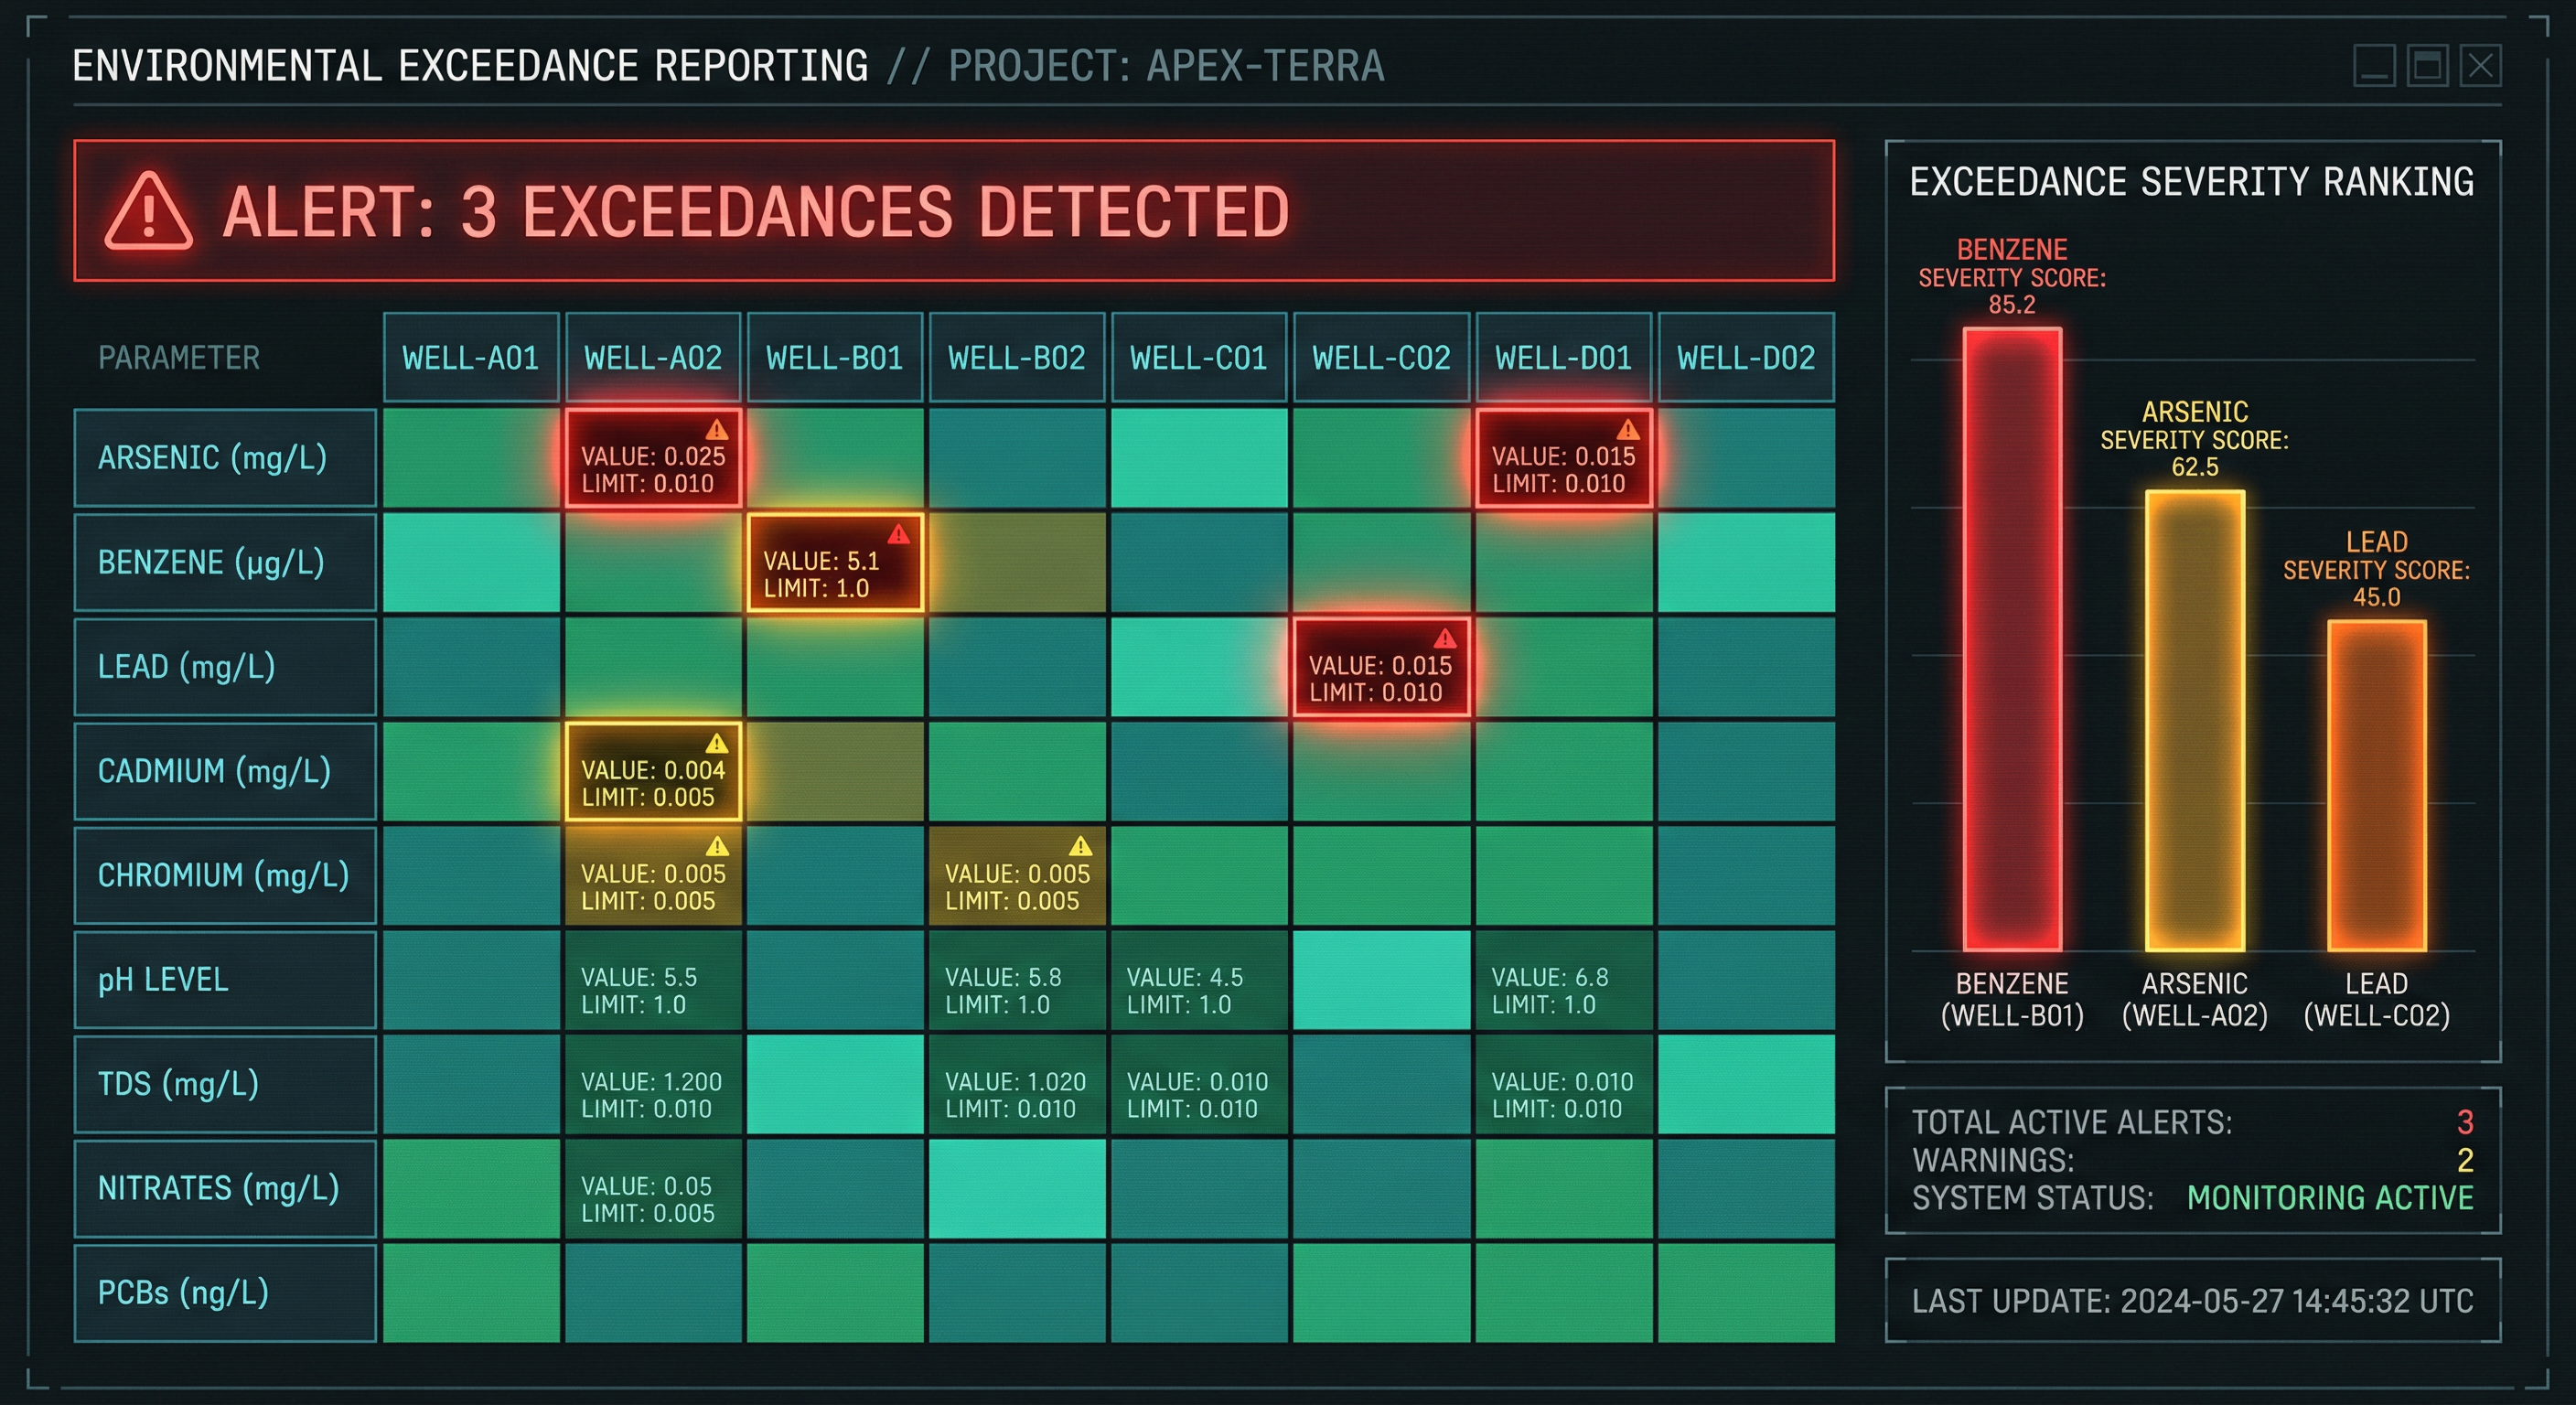
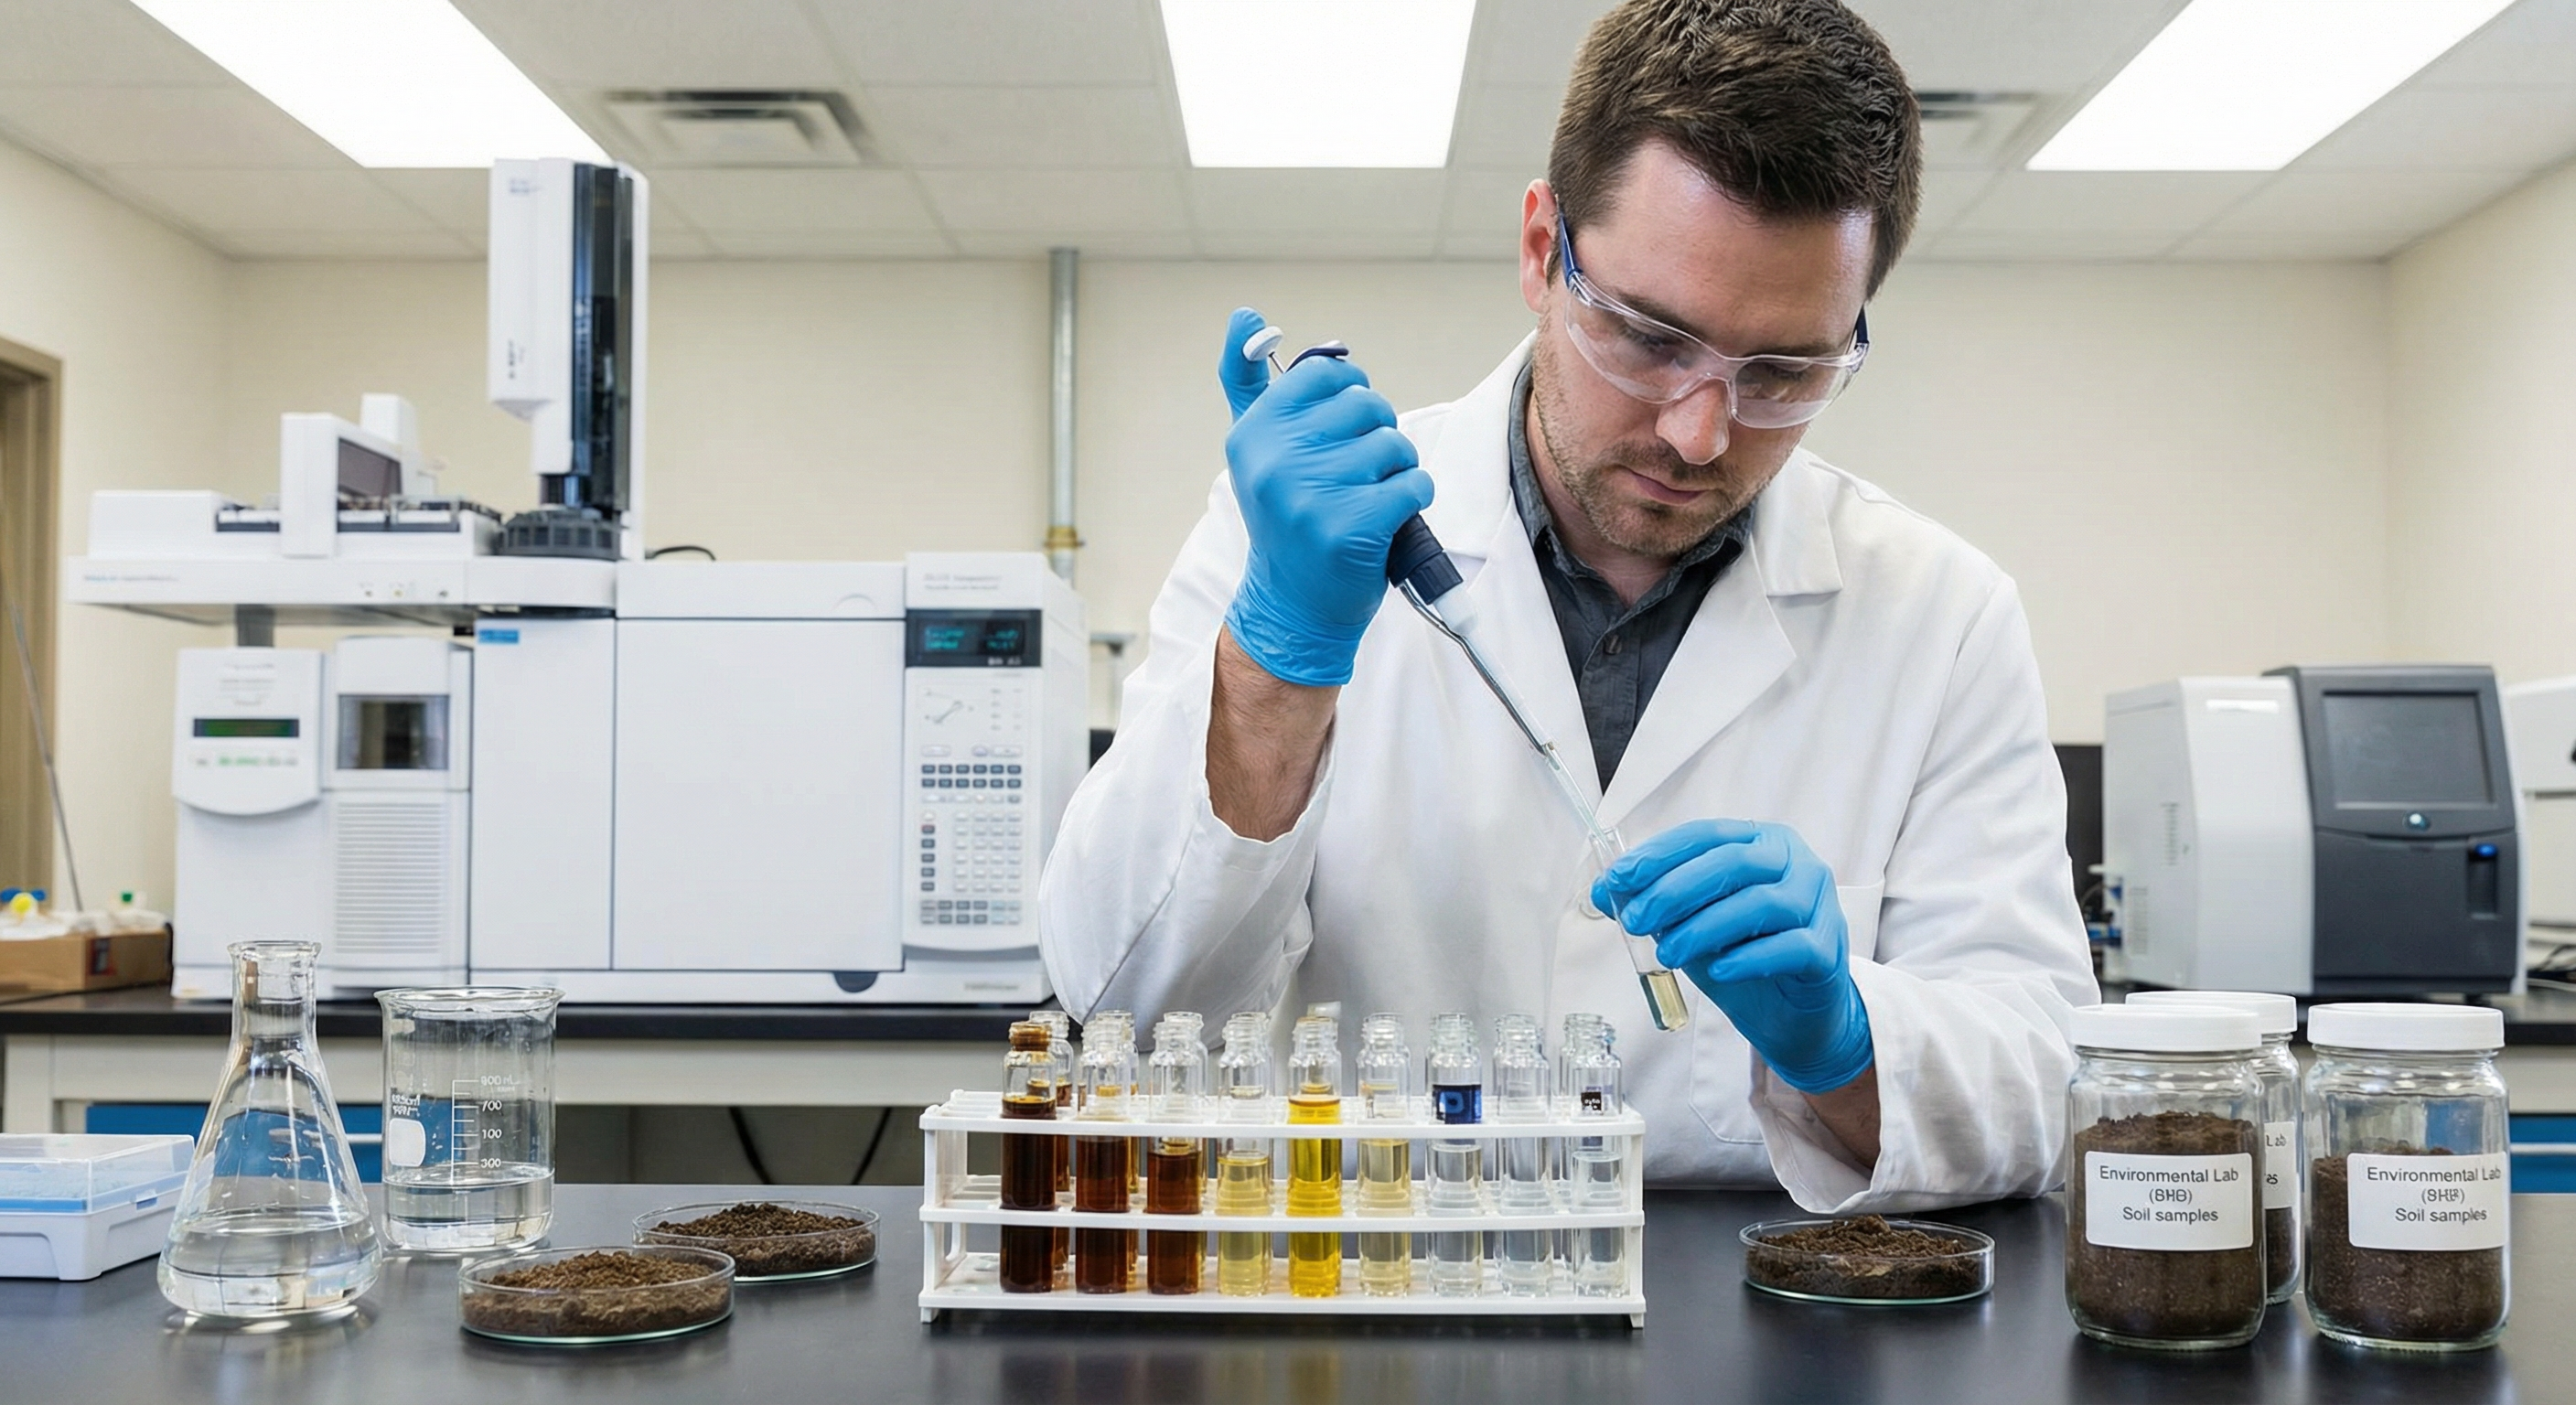
Auto-detects EDD formats from major Canadian labs, maps analyte aliases to canonical names, normalizes units (mg/L, µg/L, mg/kg, ppm, ppb), and reconciles QA/QC flags. Carries a conversion audit trail for every value touched.
Module 2
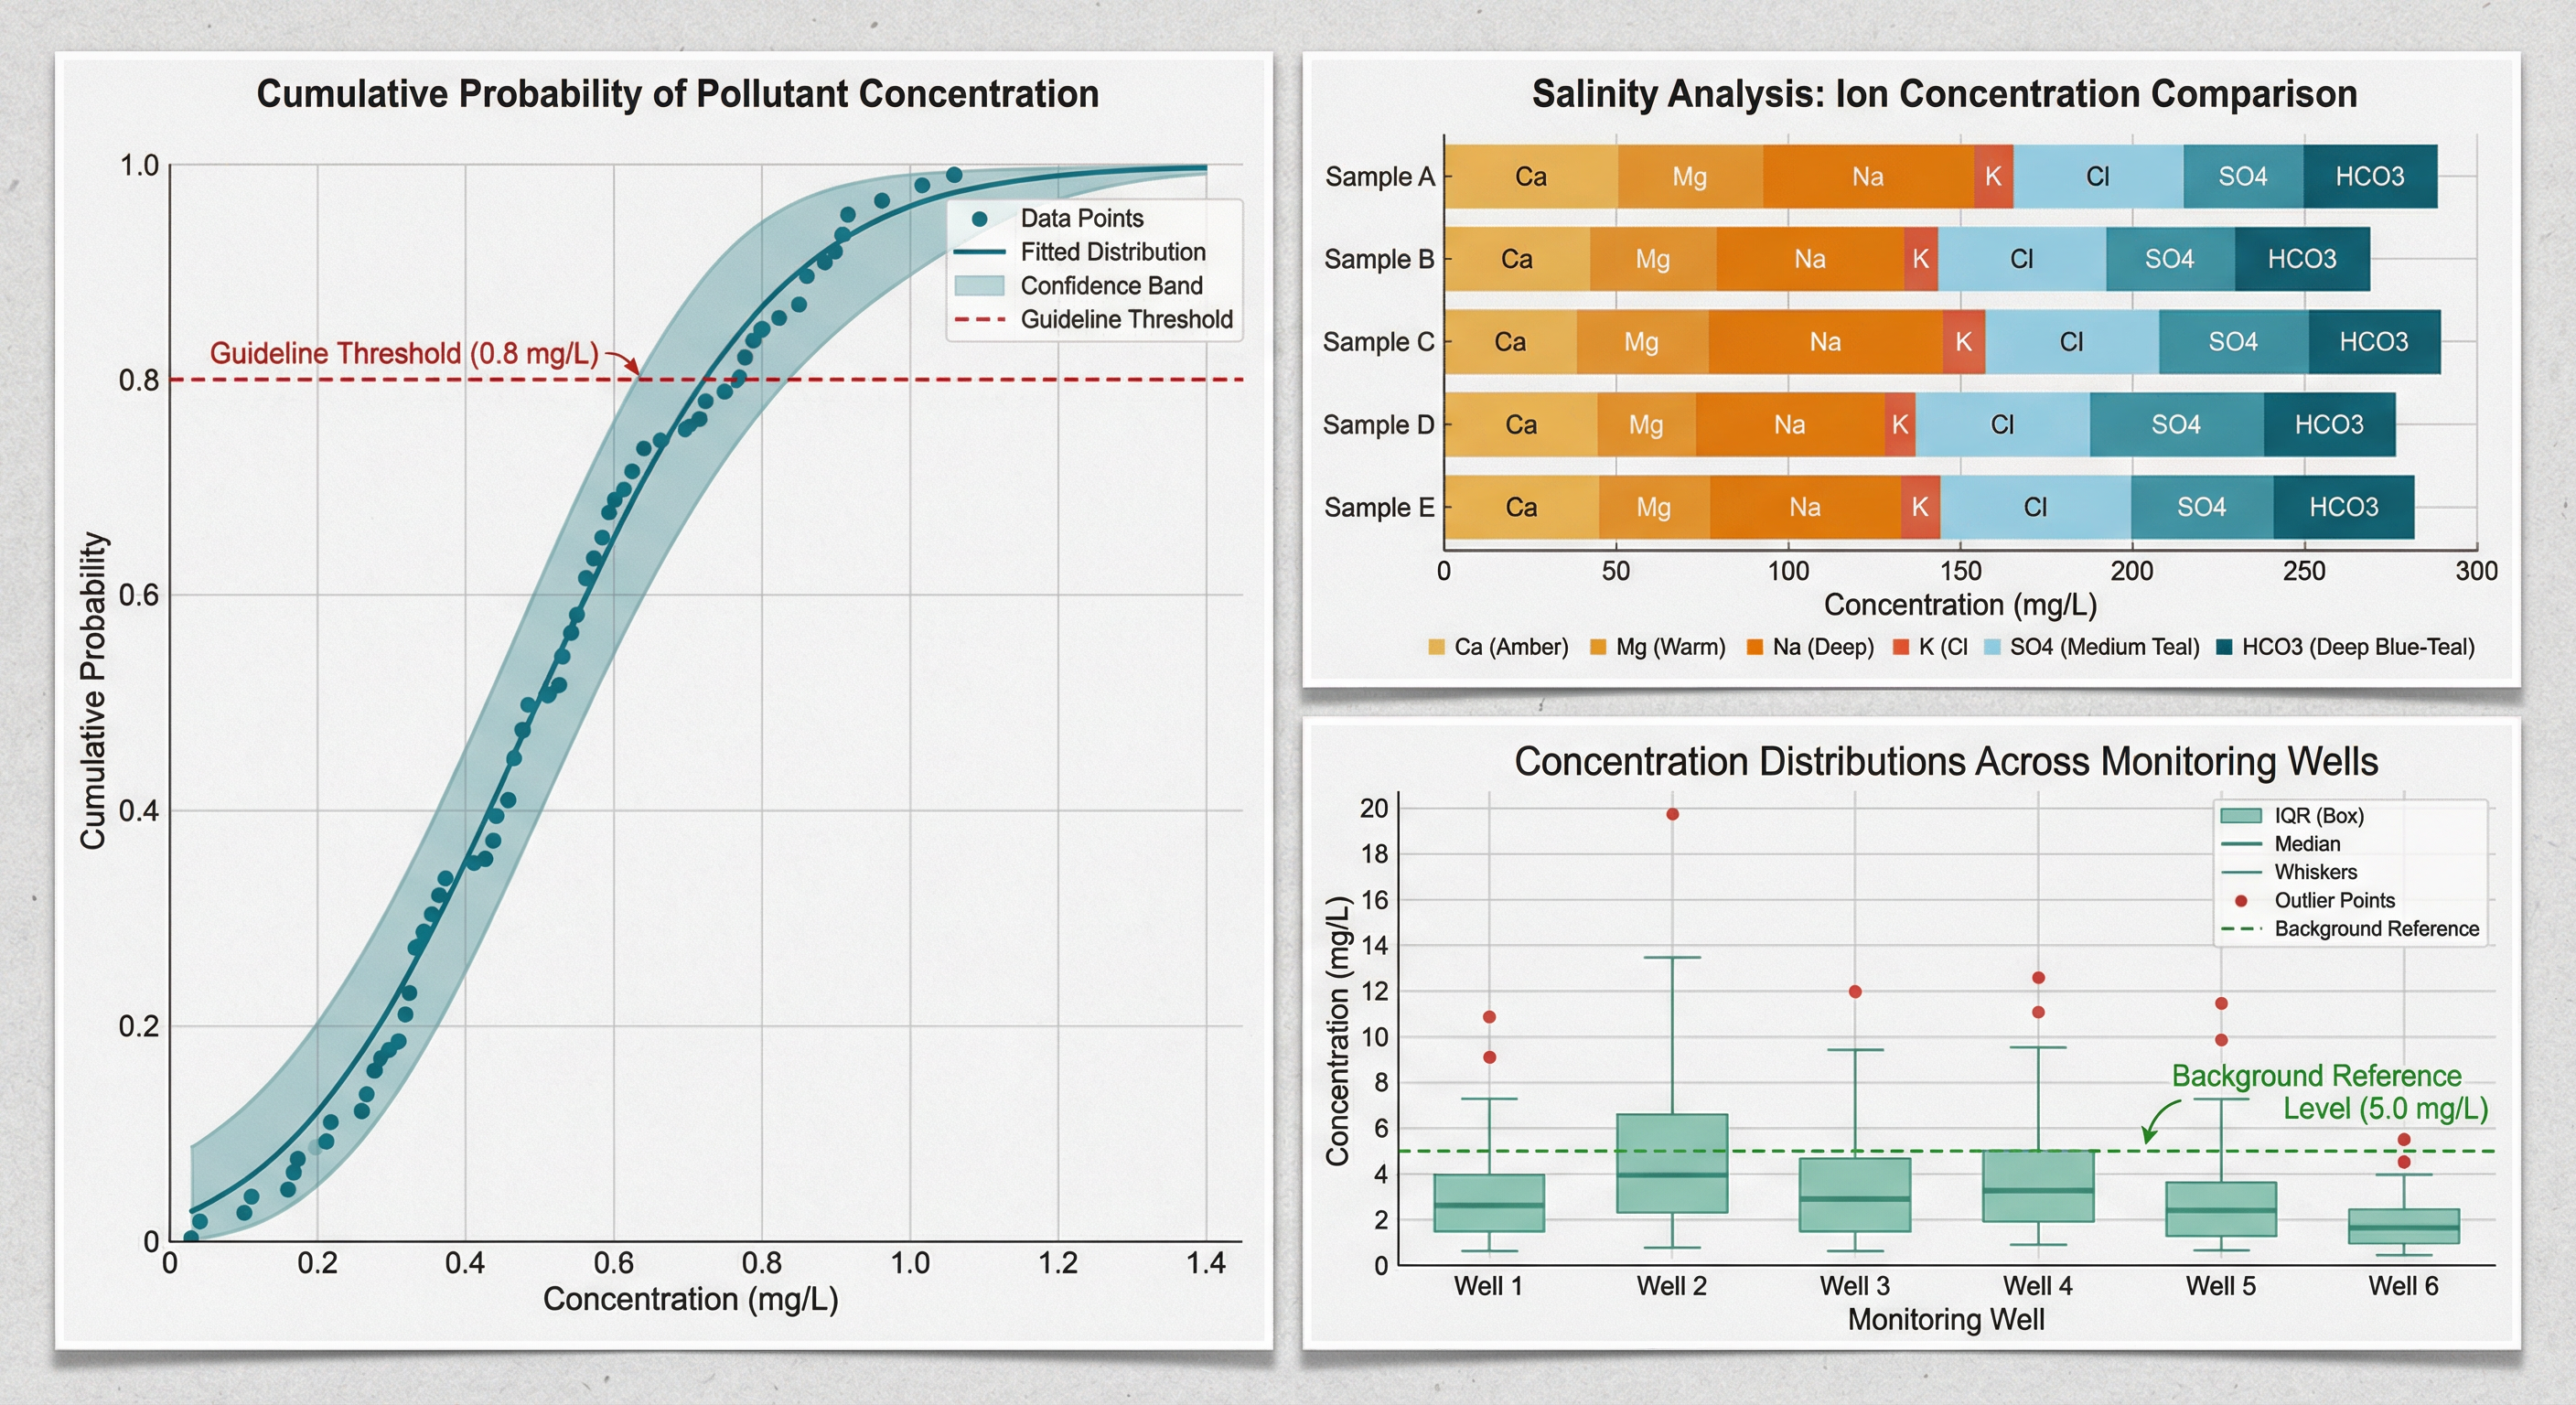
Salinity
Converts between EC (dS/m, mS/cm, µS/cm), SAR inputs, soluble cations/anions, and ion balance. Handles 1:1, 1:2, and saturated-paste extracts, with depth-bin awareness for prairie agricultural sites.
Module 3
Hydrocarbon
Reconciles PHC F1–F4 fractions across CCME, Tier 2A, and provincial frameworks. BTEX and PAH speciation, sum-of-PAH calculations, and TPH normalization — with explicit handling of overlap zones between methods.
Module 4
Spatial
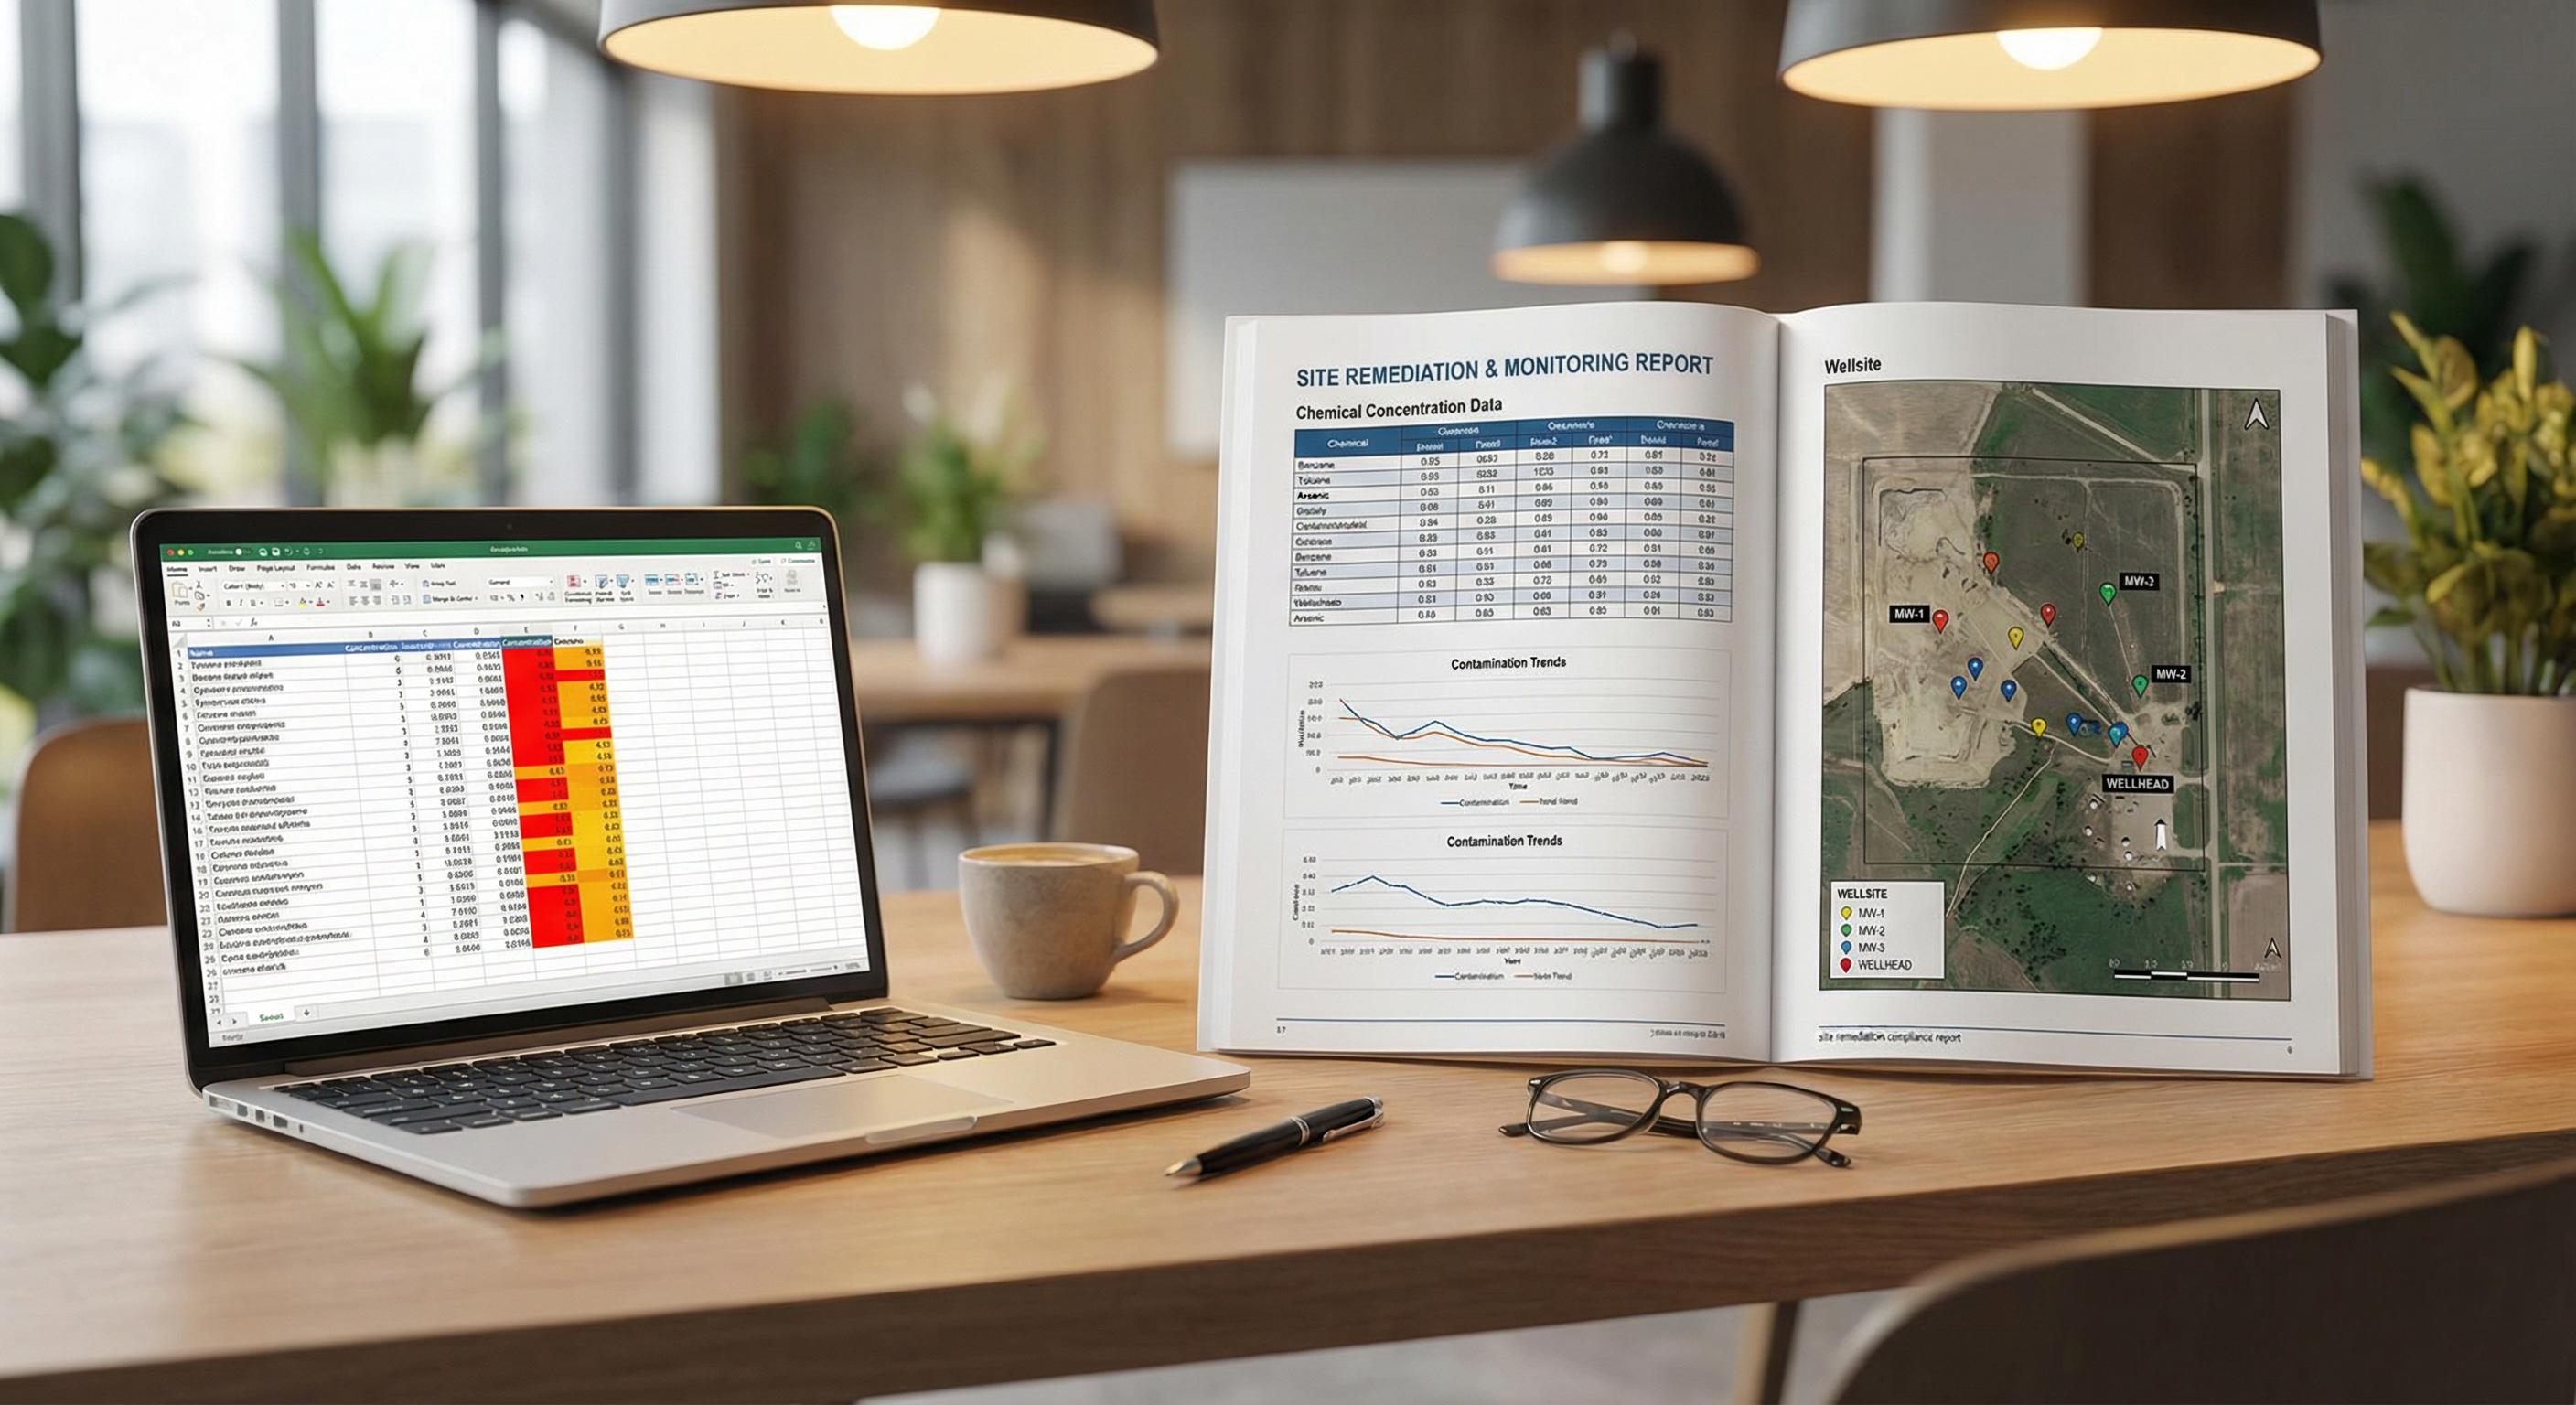
Converts between UTM zones, NAD83/WGS84 datums, ATS legal land descriptions, and local site grids. Snaps borehole and sample coordinates to a single project CRS so every downstream map, plume, and volume calculation is consistent.