From Wellsite to Closure Report
[GRYD] handles the data pipeline from field sampling through lab results to regulatory-ready compliance reporting.
Built for environmental scientists, consultants, geologists, engineers, and agrologists. From wellsite closures to agricultural salinity assessments and contaminated site remediation, [GRYD] automates analysis, flags exceedances, and delivers audit-ready reports so you can close files with confidence.
Purpose-built tools that turn environmental complexity into clear, compliant outcomes -- from Phase II ESAs to site closure.
Automated data validation and statistical analysis across soil, groundwater, and surface water parameters. No more manual crunching of lab results from wellsite investigations.
Learn more →Instant flagging when parameters breach regulatory thresholds. Catch hydrocarbon exceedances, salinity issues, and heavy metal contamination before they become audit problems.
Learn more →Multi-tiered guideline frameworks with site-specific background calibration across jurisdictions. Run multiple pathway scenarios on a single committed dataset without re-importing. Your data is always measured against defensible, site-specific standards.
Learn more →Built-in AI assistant that interprets your exceedance reports in plain language. Ask about severity, spatial patterns, specific analytes, or regulatory context — grounded in your actual screening results, not generic advice.
Learn more →Visualize your project sites with integrated GIS and plume mapping, then compute excavation soil volumes (m³) from plume contour bands per exceedance threshold. Scope remediation costs directly from your spatial data without leaving your workbook.
Learn more →A full forensic hydrogeochemistry engine -- Piper, Stiff, Gibbs, Schoeller, Wilcox, PAH Cross-Plots, and Source Discriminator diagrams for contamination origin analysis. Plus time-series trends, heatmaps, and spatial profiles -- all publication-ready.
Learn more →Four steps from raw lab data to audit-ready remediation reports.
[GRYD] lives right inside Excel as an add-in — no uploading or exporting needed. It works directly with your existing worksheets and lab results.
[GRYD] validates, cross-references guidelines, flags exceedances, and runs the statistical analysis for you.
Evaluate your data against multiple guideline configurations -- from generic screening levels to site-specific background calibration, custom overrides, and ND policy definitions. Re-screen with different pathway configurations on a locked dataset without re-importing.
Get clear, compliance-ready reports with visual summaries, trend tracking, and defensible audit trails for regulatory submission.
Real feedback from environmental consultants using [GRYD] in the field.
"We cut our Phase II reporting timeline by 35%. [GRYD] flagged the data gaps immediately, allowing us to mobilize for remediation weeks ahead of schedule."
"The automated validation is a game changer. We caught a salinity exceedance that manual review missed, saving us a potential audit nightmare on a wellsite closure."
Insights from the field on environmental assessment, remediation, and the tools reshaping how consultants work.
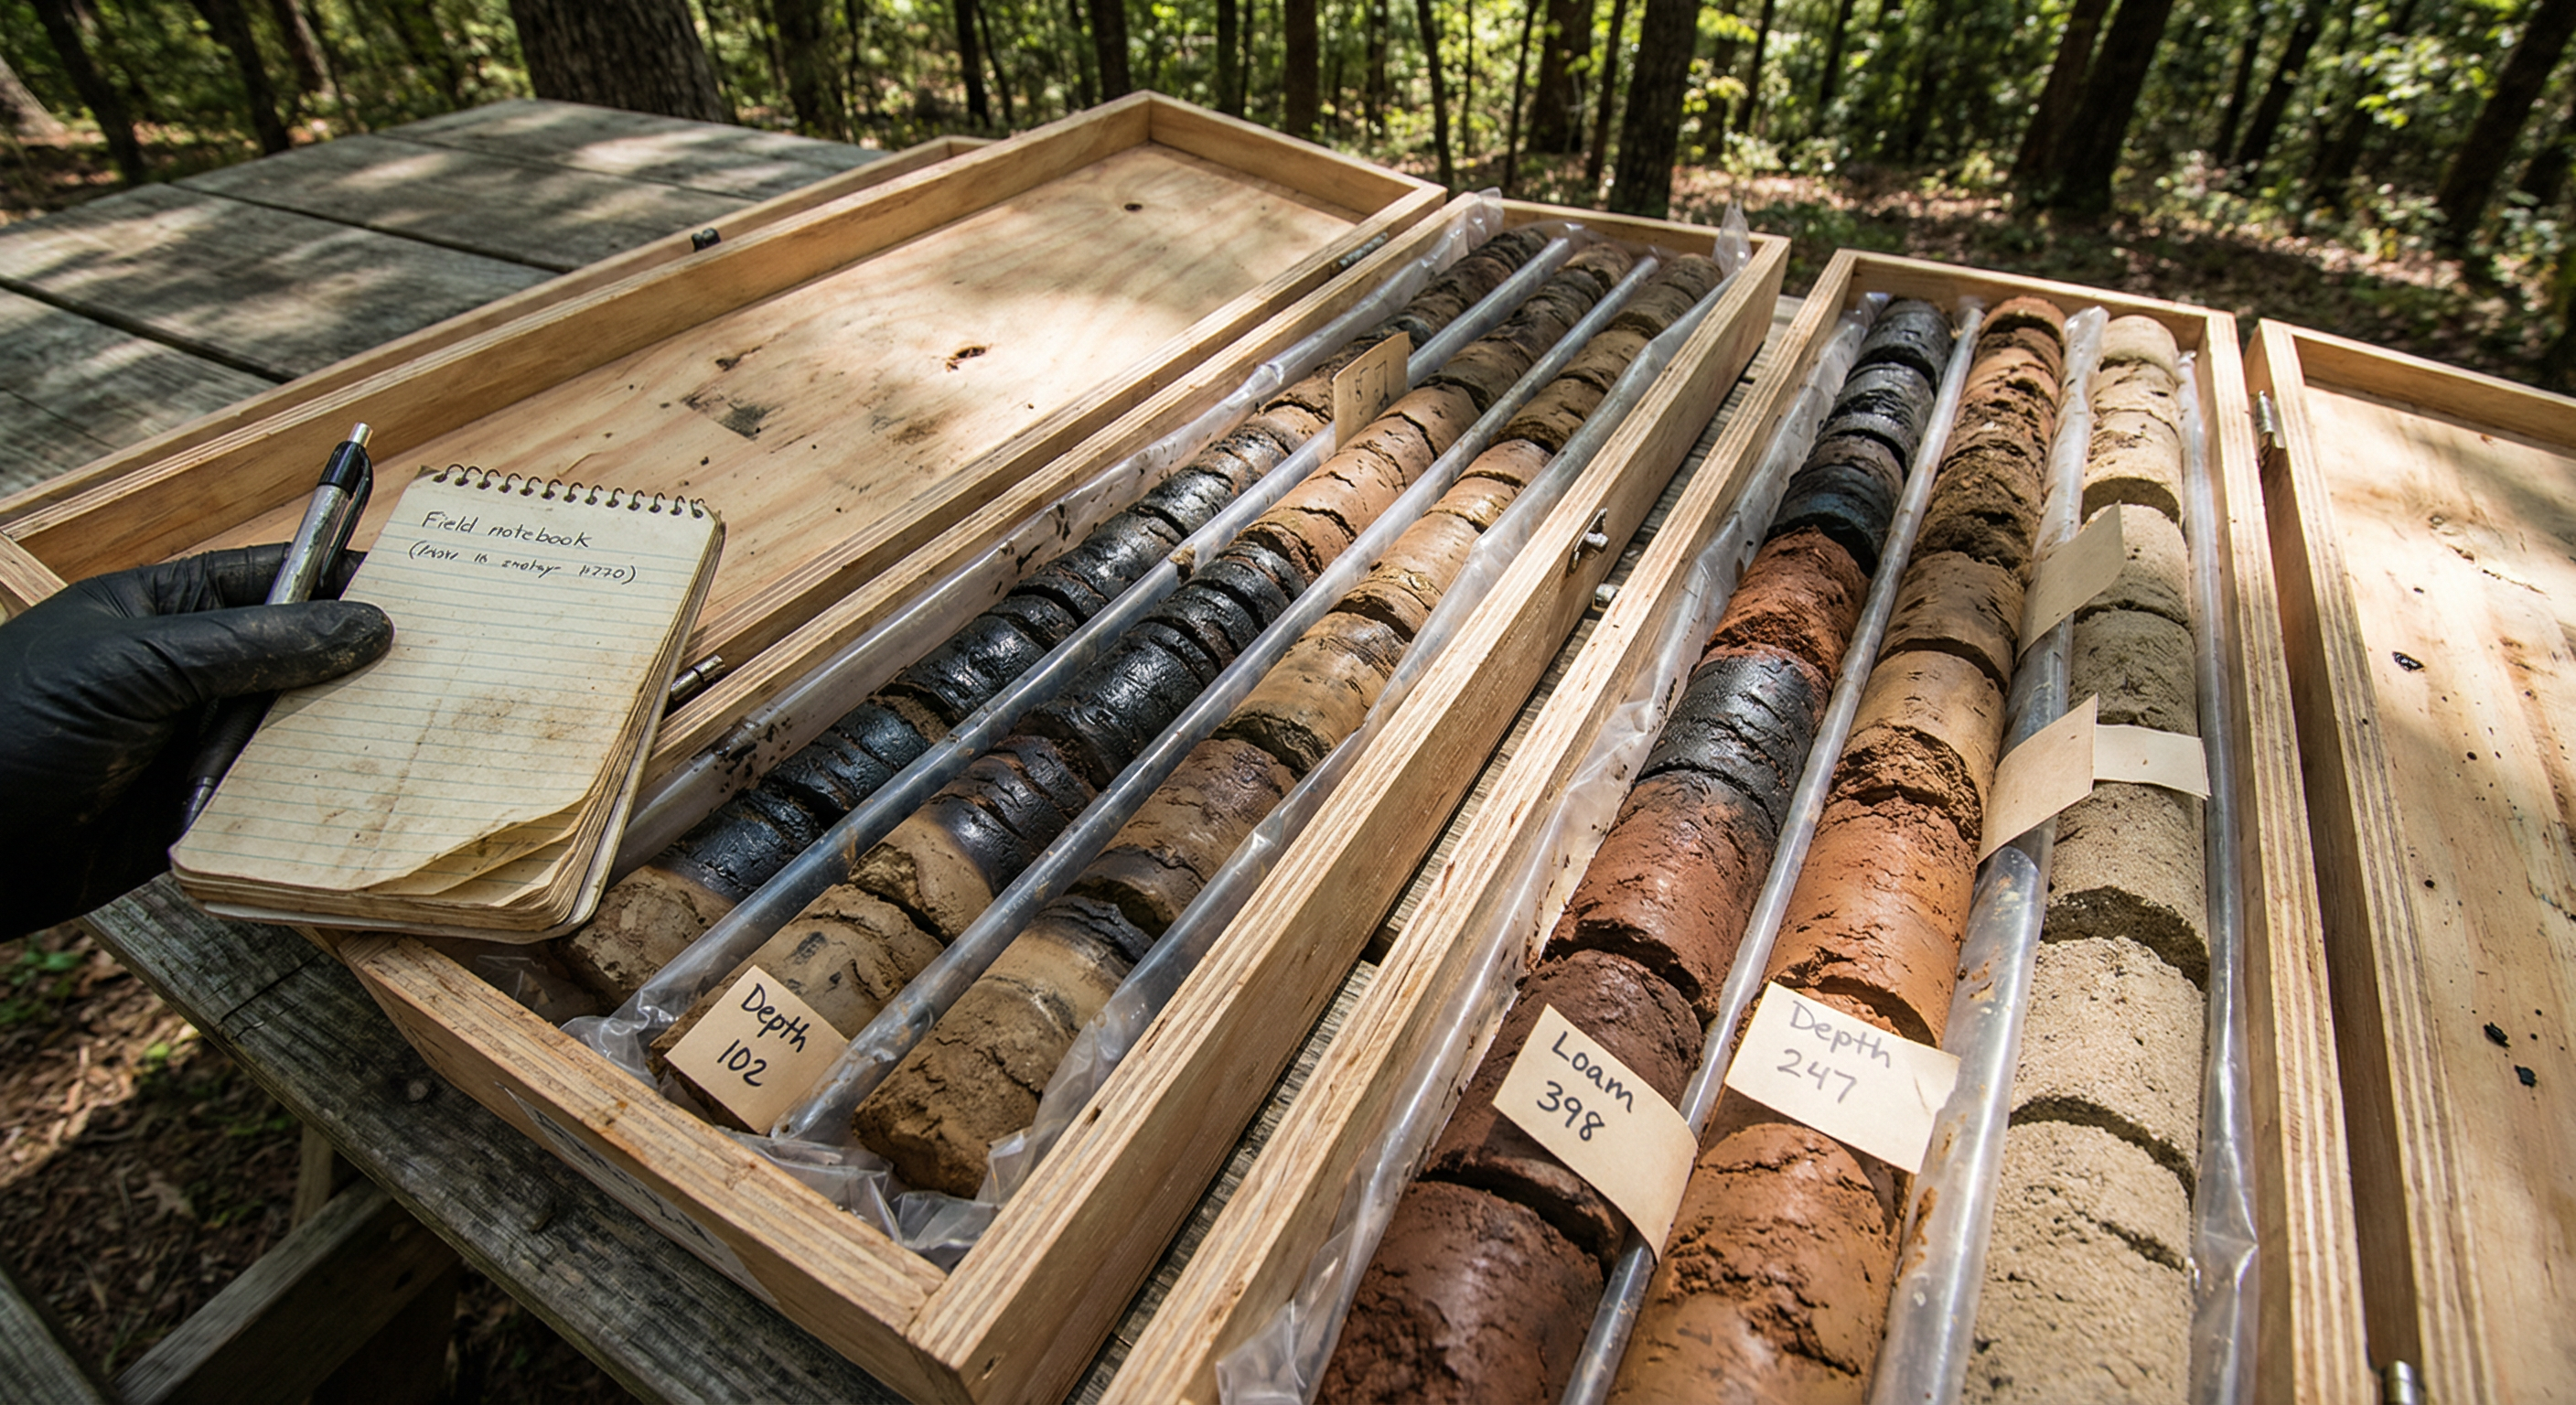
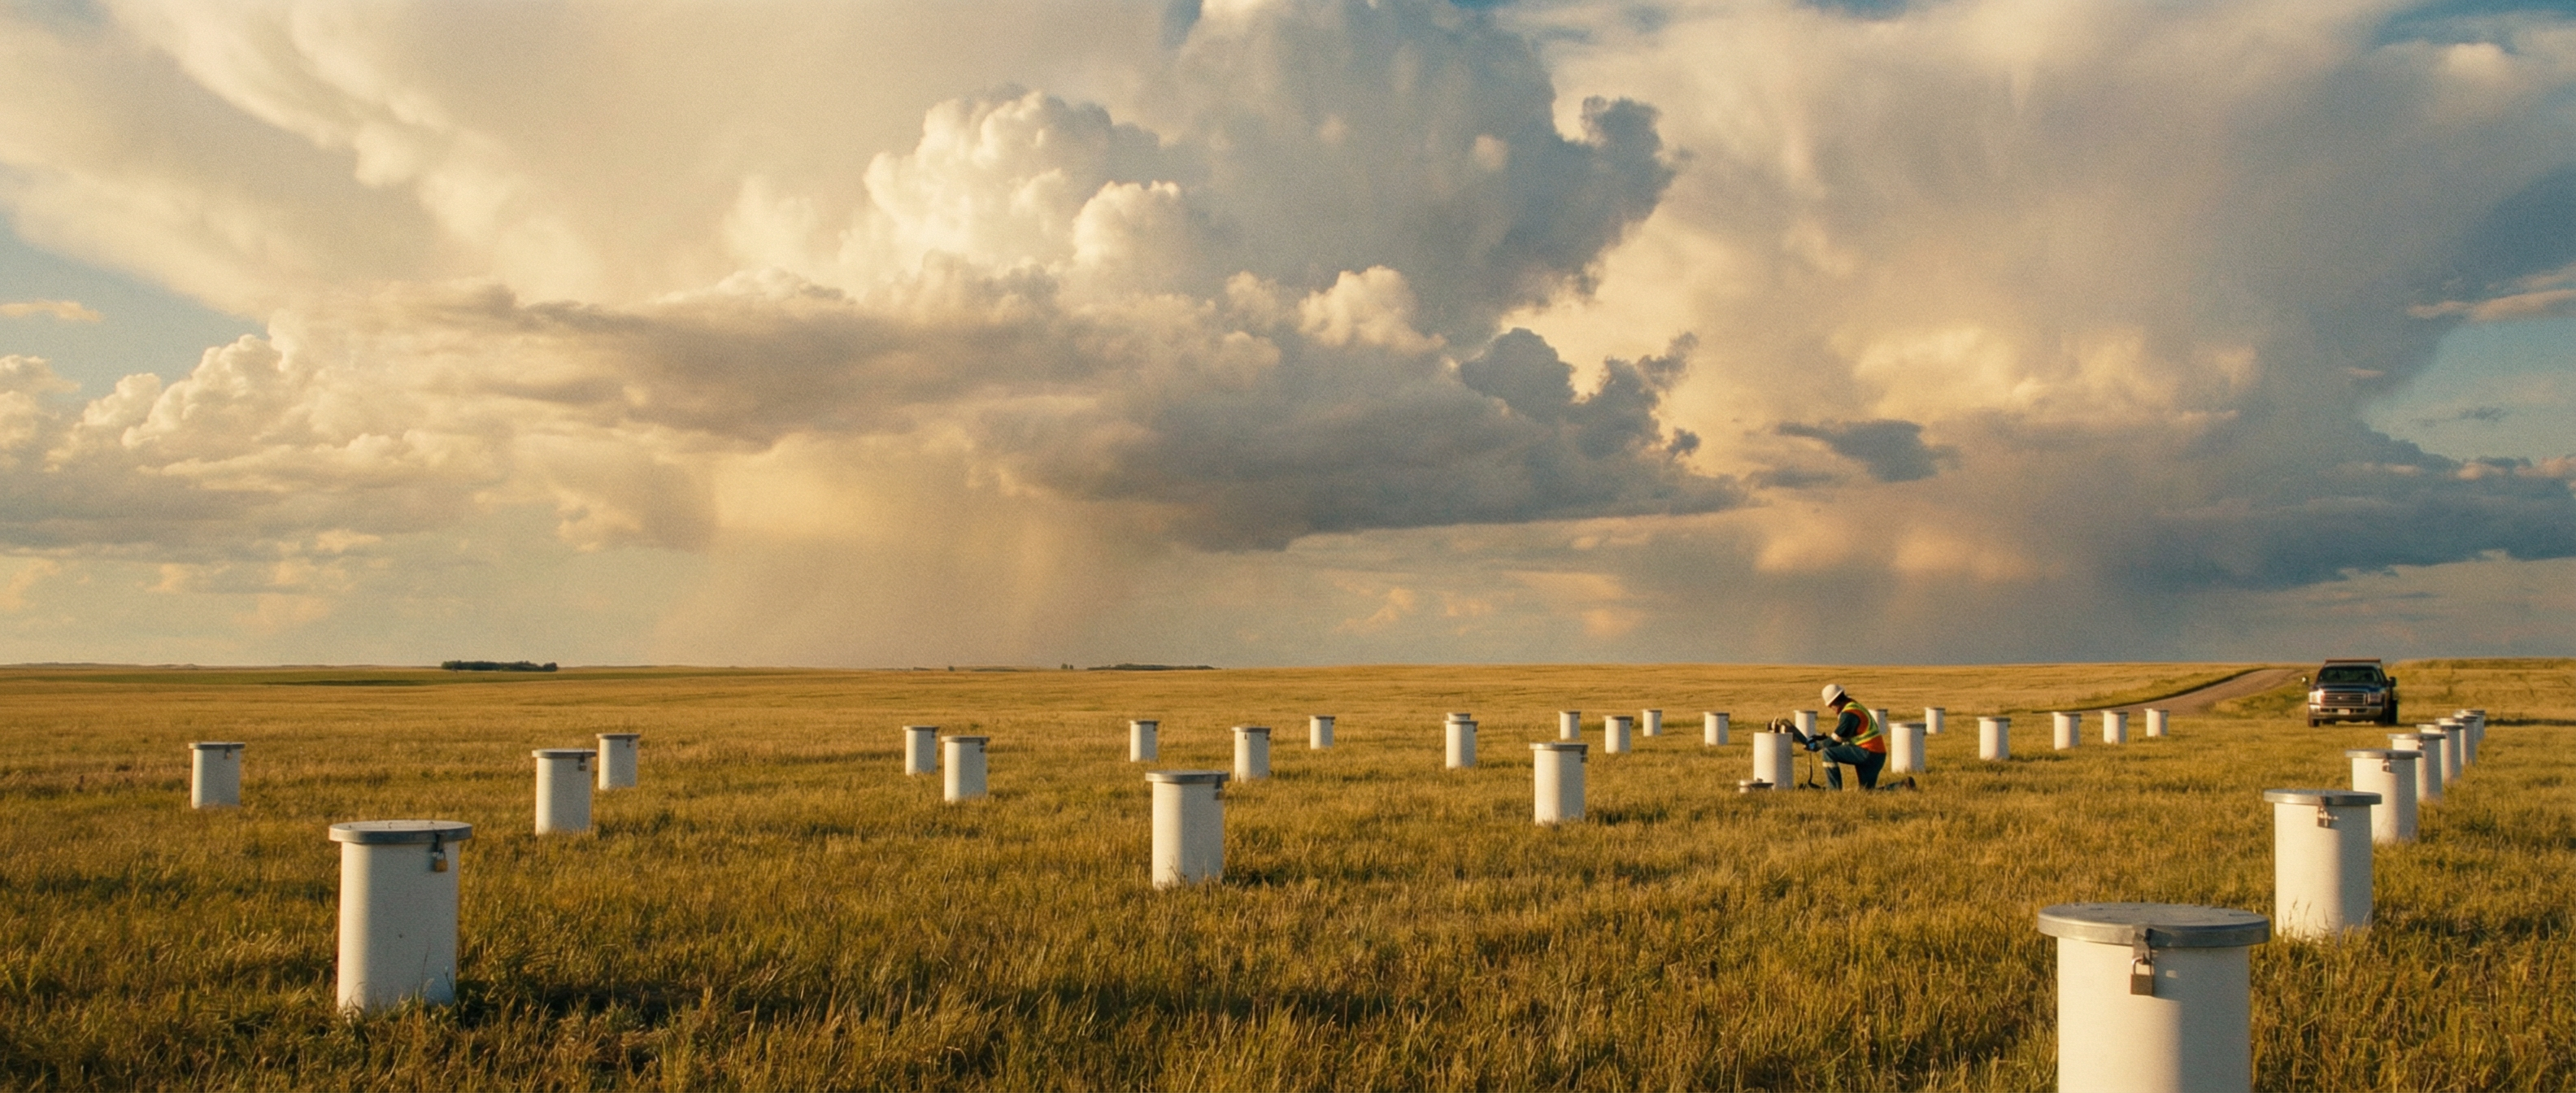
From borehole drilling to lab analysis -- a practical walkthrough of the Phase II process and why getting the analysis right matters.
Read article →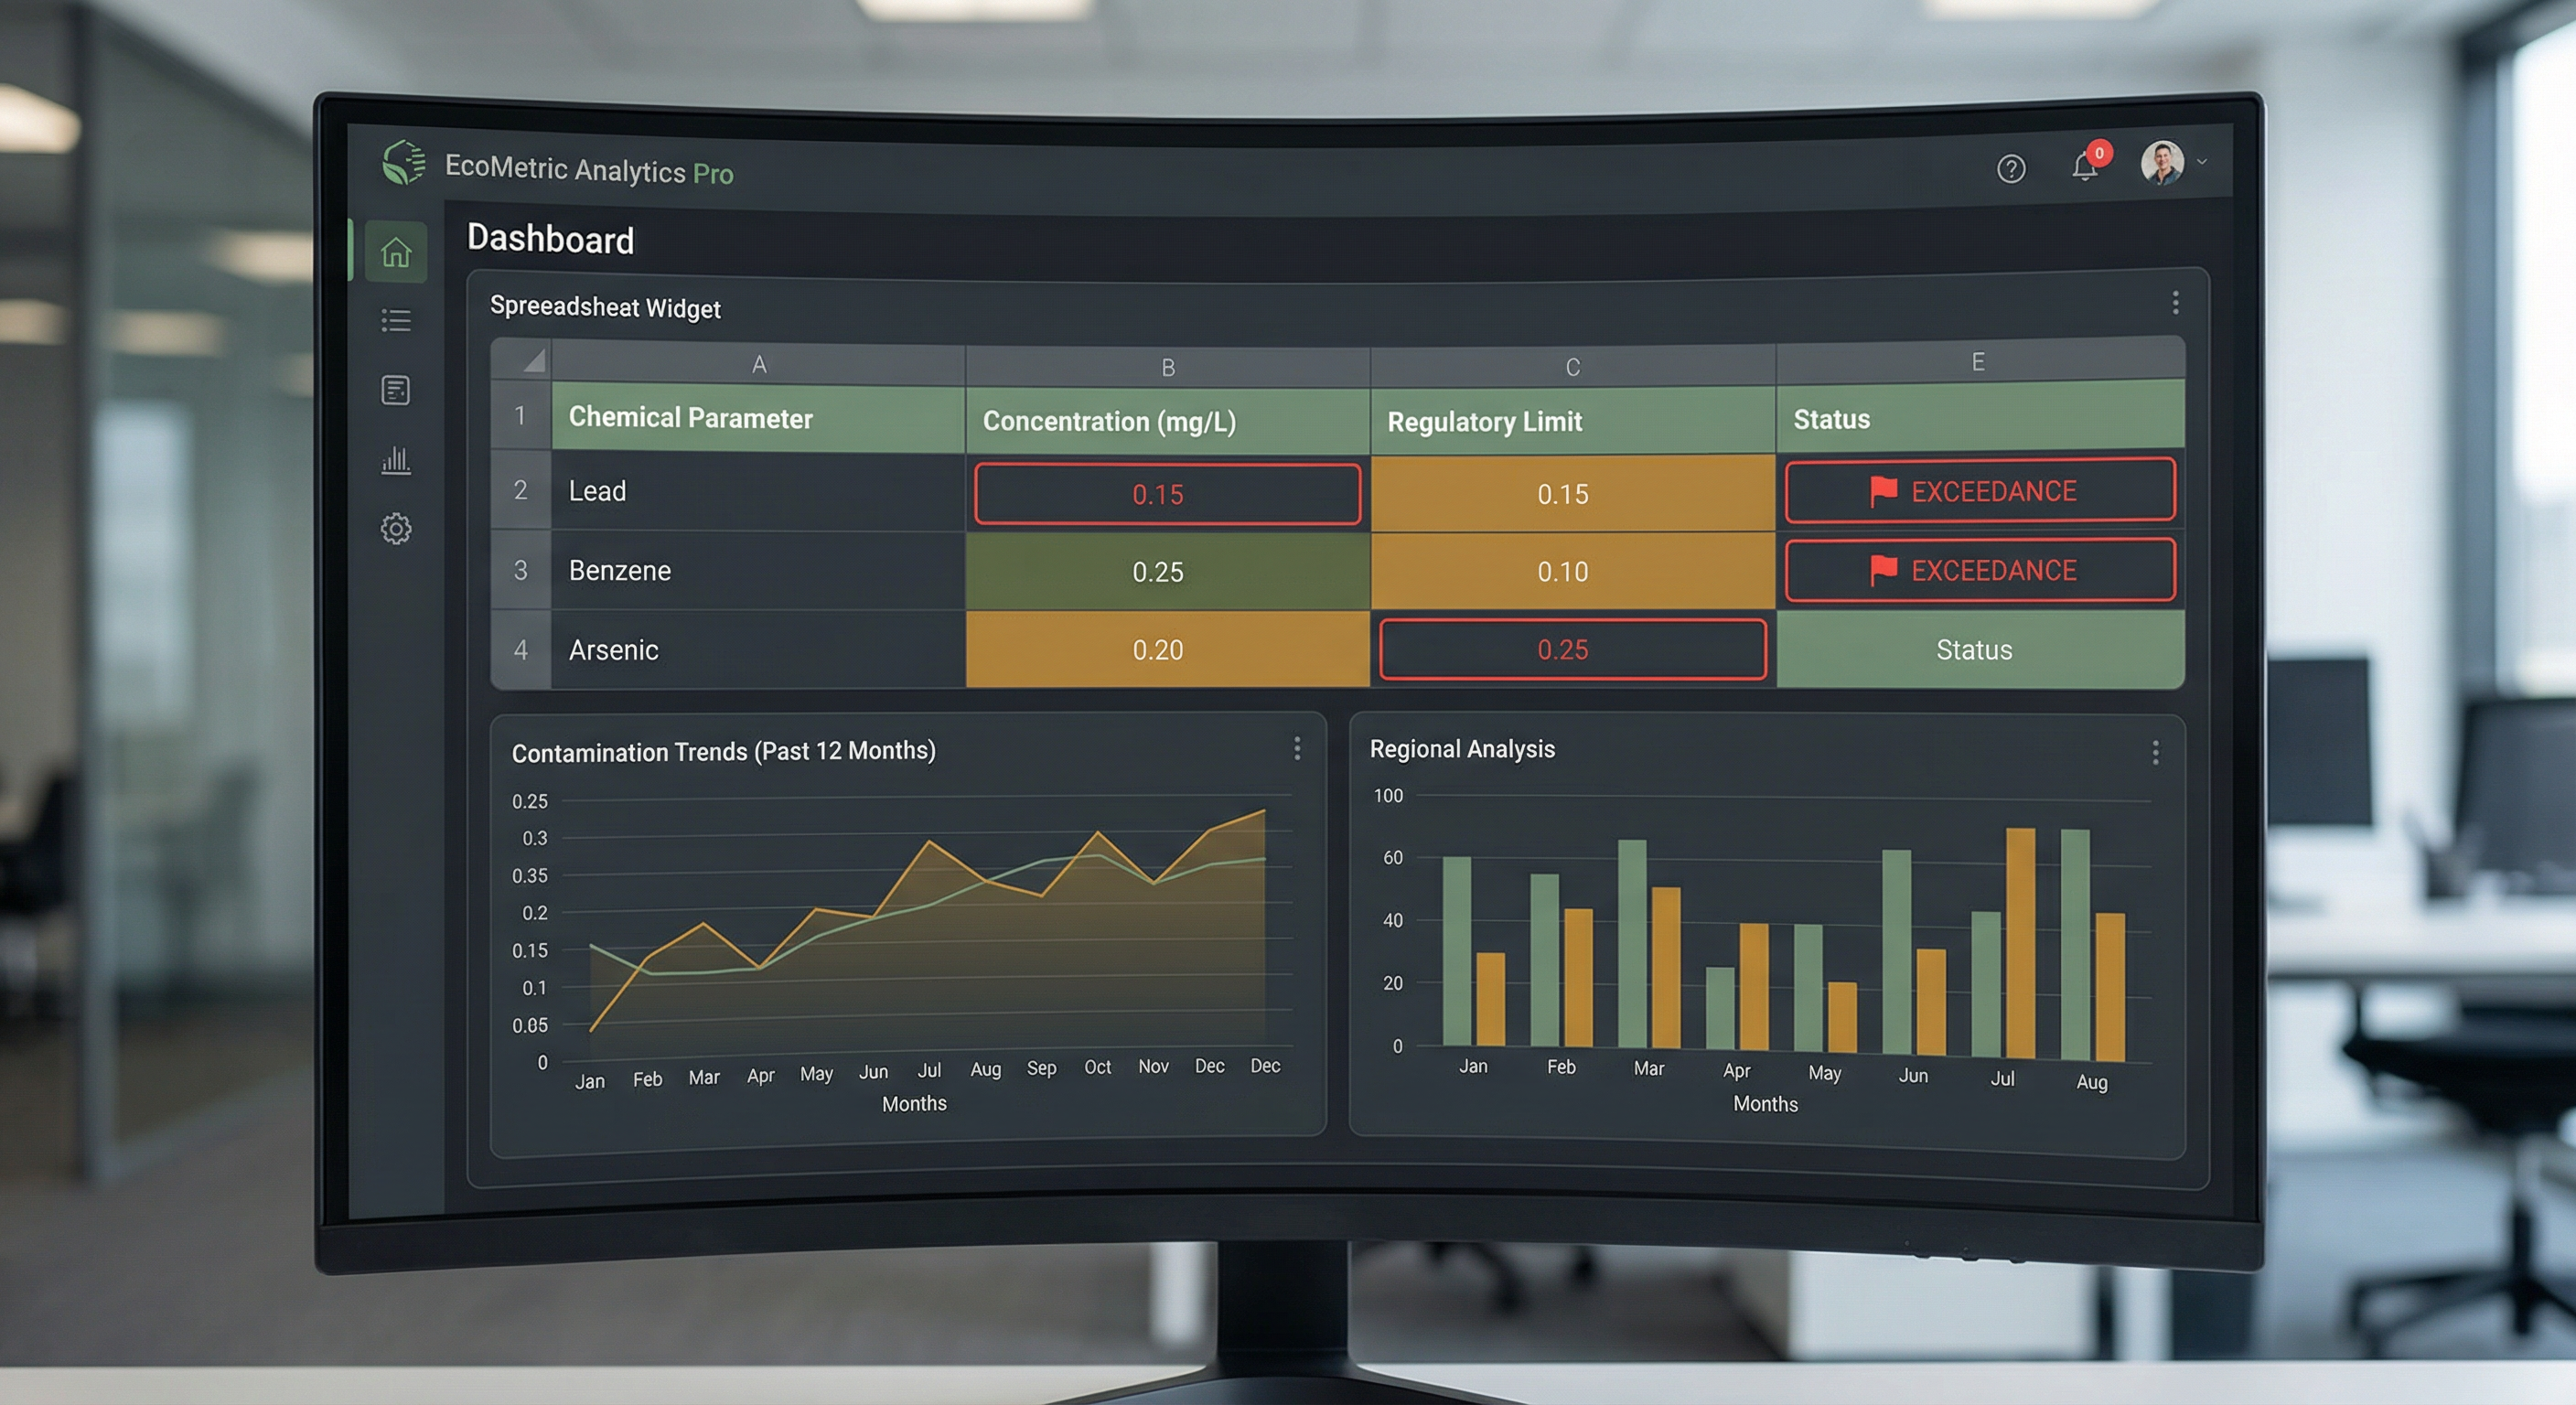
47 parameters, 12 monitoring wells, land-use-specific guidelines. Here's why spreadsheets aren't cutting it anymore.
Read article →